
User Guide


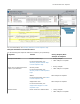
Table Of Contents

Prerequisites
You can use the Intel Inspector to analyze memory and threading errors in both debug and release modes of
C++ and Fortran binaries. To build applications that produce the most accurate and complete Intel Inspector
analysis results:
• Build your application in debug mode.
• Use optimal compiler/linker settings. For more information, see Building Applications in Intel Inspector
Help.
• Ensure your application creates more than one thread before you run threading analyses.
In addition:
• Verify your application runs outside the Intel Inspector environment.
• Ensure you set the EDITOR or VISUAL environment variable to your text editor.
• Do one of the following to set up your environment:
• Run one of the following source commands:
• For csh/tcsh users: source <inspector-install-dir>/inspxe-vars.csh
• For bash users: source <inspector-install-dir>/inspxe-vars.sh
• The name of this script for the application as part of an Intel
®
oneAPI HPC Toolkit or Intel
®
oneAPI
IoT Toolkit installation is env\vars instead of inspxe-vars.
The default installation path, <inspector-install-dir>, is below:
• /opt/intel/oneapi/inspector for root users
• $HOME/intel/oneapi/inspector for non-root users
• Add <inspector-install-dir>/bin32 or <inspector-install-dir>/bin64 to your path.
For more information, see
Building Applications in Intel Inspector Help.
Get Started
Follow these steps to get started using the Intel Inspector.
Launch the Intel Inspector
To launch the Intel Inspector standalone GUI, run the inspxe-gui command.
Get Started with Intel
®
Inspector
9