
Intel 64 and IA-32 Architectures Software Developers Manual Volume 3B, System Programming Guide Part 2
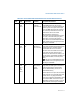
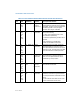
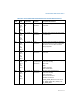
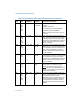
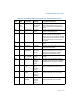
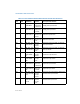
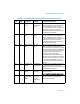
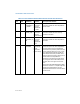
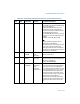
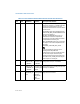
Table Of Contents
- Chapter 18 Debugging and Performance Monitoring
- 18.1 Overview of Debug Support Facilities
- 18.2 Debug Registers
- 18.3 Debug Exceptions
- 18.4 Last Branch Recording Overview
- 18.5 Last Branch, Interrupt, and Exception Recording (Intel® Core™2 Duo and Intel® Atom™ Processor Family)
- 18.6 Last Branch, Interrupt, and Exception Recording (Intel® Core™i7 Processor Family)
- 18.7 Last Branch, Interrupt, and Exception Recording (Processors based on Intel NetBurst® Microarchitecture)
- 18.7.1 CPL-Qualified Branch Trace Mechanism
- 18.7.2 MSR_DEBUGCTLA MSR
- 18.7.3 LBR Stack for Processors Based on Intel NetBurst Microarchitecture
- 18.7.4 Monitoring Branches, Exceptions, and Interrupts
- 18.7.5 Single-Stepping on Branches, Exceptions, and Interrupts
- 18.7.6 Branch Trace Messages
- 18.7.7 Last Exception Records
- 18.7.8 Branch Trace Store (BTS)
- 18.8 Last Branch, Interrupt, and Exception Recording (Intel® Core™ Solo and Intel® Core™ Duo Processors)
- 18.9 Last Branch, Interrupt, and Exception Recording (Pentium M Processors)
- 18.10 Last Branch, Interrupt, and Exception Recording (P6 Family Processors)
- 18.11 Time-Stamp Counter
- 18.12 Performance Monitoring Overview
- 18.13 Architectural Performance Monitoring
- 18.14 Performance Monitoring (Intel® Core™ Solo and Intel® Core™ Duo Processors)
- 18.15 Performance Monitoring (Processors based on Intel® Core™ Microarchitecture)
- 18.16 Performance Monitoring (Processors based on Intel® Atom™ Microarchitecture)
- 18.17 Performance Monitoring for Processors based on Intel® Microarchitecture (Nehalem)
- 18.18 Performance Monitoring (Processors Based on Intel NetBurst microarchitecture)
- 18.18.1 ESCR MSRs
- 18.18.2 Performance Counters
- 18.18.3 CCCR MSRs
- 18.18.4 Debug Store (DS) Mechanism
- 18.18.5 DS Save Area
- 18.18.6 Programming the Performance Counters for Non-Retirement Events
- 18.18.6.1 Selecting Events to Count
- 18.18.6.2 Filtering Events
- 18.18.6.3 Starting Event Counting
- 18.18.6.4 Reading a Performance Counter’s Count
- 18.18.6.5 Halting Event Counting
- 18.18.6.6 Cascading Counters
- 18.18.6.7 EXTENDED CASCADING
- 18.18.6.8 Generating an Interrupt on Overflow
- 18.18.6.9 Counter Usage Guideline
- 18.18.7 At-Retirement Counting
- 18.18.8 Precise Event-Based Sampling (PEBS)
- 18.18.9 Operating System Implications
- 18.19 Performance Monitoring and Intel Hyper- Threading Technology in Processors Based on Intel NetBurst Microarchitecture
- 18.20 Counting Clocks
- 18.21 Performance Monitoring, Branch Profiling and System Events
- 18.22 Performance Monitoring and Dual-Core Technology
- 18.23 Performance Monitoring on 64-bit Intel Xeon Processor MP with Up to 8-MByte L3 Cache
- 18.24 Performance Monitoring on L3 and Caching Bus Controller sub-systems
- 18.25 Performance Monitoring (P6 Family Processor)
- 18.26 Performance Monitoring (Pentium Processors)
- Chapter 19 Introduction to Virtual-Machine Extensions
- Chapter 20 Virtual-Machine Control Structures
- 20.1 Overview
- 20.2 Format of the VMCS Region
- 20.3 Organization of VMCS Data
- 20.4 Guest-State Area
- 20.5 Host-State Area
- 20.6 VM-Execution Control Fields
- 20.6.1 Pin-Based VM-Execution Controls
- 20.6.2 Processor-Based VM-Execution Controls
- 20.6.3 Exception Bitmap
- 20.6.4 I/O-Bitmap Addresses
- 20.6.5 Time-Stamp Counter Offset
- 20.6.6 Guest/Host Masks and Read Shadows for CR0 and CR4
- 20.6.7 CR3-Target Controls
- 20.6.8 Controls for APIC Accesses
- 20.6.9 MSR-Bitmap Address
- 20.6.10 Executive-VMCS Pointer
- 20.6.11 Extended-Page-Table Pointer (EPTP)
- 20.6.12 Virtual-Processor Identifier (VPID)
- 20.7 VM-Exit Control Fields
- 20.8 VM-Entry Control Fields
- 20.9 VM-Exit Information Fields
- 20.10 Software Access to the VMCS and Related Structures
- 20.11 Using VMCLEAR to Initialize a VMCS Region
- Chapter 21 VMX Non-Root Operation
- 21.1 Instructions That Cause VM Exits
- 21.2 APIC-Access VM Exits
- 21.3 Other Causes of VM Exits
- 21.4 Changes to Instruction Behavior in VMX Non- Root Operation
- 21.5 APIC Accesses That Do Not Cause VM Exits
- 21.6 Other Changes in VMX Non-Root Operation
- 21.7 Features Specific to VMX Non-Root Operation
- Chapter 22 VM Entries
- 22.1 Basic VM-Entry Checks
- 22.2 Checks on VMX Controls and Host-State Area
- 22.3 Checking and Loading Guest State
- 22.3.1 Checks on the Guest State Area
- 22.3.1.1 Checks on Guest Control Registers, Debug Registers, and MSRs
- 22.3.1.2 Checks on Guest Segment Registers
- 22.3.1.3 Checks on Guest Descriptor-Table Registers
- 22.3.1.4 Checks on Guest RIP and RFLAGS
- 22.3.1.5 Checks on Guest Non-Register State
- 22.3.1.6 Checks on Guest Page-Directory-Pointer-Table Entries
- 22.3.2 Loading Guest State
- 22.3.3 Clearing Address-Range Monitoring
- 22.3.1 Checks on the Guest State Area
- 22.4 Loading MSRs
- 22.5 Event Injection
- 22.6 Special Features of VM Entry
- 22.6.1 Interruptibility State
- 22.6.2 Activity State
- 22.6.3 Delivery of Pending Debug Exceptions after VM Entry
- 22.6.4 VMX-Preemption Timer
- 22.6.5 Interrupt-Window Exiting
- 22.6.6 NMI-Window Exiting
- 22.6.7 VM Exits Induced by the TPR Shadow
- 22.6.8 Pending MTF VM Exits
- 22.6.9 VM Entries and Advanced Debugging Features
- 22.7 VM-Entry Failures During or After Loading Guest State
- 22.8 Machine Checks During VM Entry
- Chapter 23 VM Exits
- 23.1 Architectural State Before a VM Exit
- 23.2 Recording VM-Exit Information and Updating VM-Entry Control Fields
- 23.3 Saving Guest State
- 23.4 Saving MSRs
- 23.5 Loading Host State
- 23.5.1 Loading Host Control Registers, Debug Registers, MSRs
- 23.5.2 Loading Host Segment and Descriptor-Table Registers
- 23.5.3 Loading Host RIP, RSP, and RFLAGS
- 23.5.4 Checking and Loading Host Page-Directory-Pointer-Table Entries
- 23.5.5 Updating Non-Register State
- 23.5.6 Clearing Address-Range Monitoring
- 23.6 Loading MSRs
- 23.7 VMX Aborts
- 23.8 Machine Check During VM Exit
- Chapter 24 Support for Address Translation
- 24.1 Virtual Processor Identifiers (VPIDs)
- 24.2 Extended Page Tables (EPT)
- 24.3 Caching Translation Information
- Chapter 25 System Management
- 25.1 System Management Mode Overview
- 25.2 System Management Interrupt (SMI)
- 25.3 Switching Between SMM and the Other Processor Operating Modes
- 25.4 SMRAM
- 25.5 SMI Handler Execution Environment
- 25.6 Exceptions and Interrupts Within SMM
- 25.7 Managing Synchronous and Asynchronous System Management Interrupts
- 25.8 NMI Handling While in SMM
- 25.9 SMM Revision Identifier
- 25.10 Auto HALT Restart
- 25.11 SMBASE Relocation
- 25.12 I/O Instruction Restart
- 25.13 SMM Multiple-Processor Considerations
- 25.14 Default Treatment of SMIs and SMM with VMX Operation and SMX Operation
- 25.15 Dual-Monitor Treatment of SMIs and SMM
- 25.15.1 Dual-Monitor Treatment Overview
- 25.15.2 SMM VM Exits
- 25.15.3 Operation of an SMM Monitor
- 25.15.4 VM Entries that Return from SMM
- 25.15.4.1 Checks on the Executive-VMCS Pointer Field
- 25.15.4.2 Checks on VM-Execution Control Fields
- 25.15.4.3 Checks on VM-Entry Control Fields
- 25.15.4.4 Checks on Guest Non-Register State
- 25.15.4.5 Loading Guest State
- 25.15.4.6 VMX-Preemption Timer
- 25.15.4.7 Updating the Current-VMCS and SMM-Transfer VMCS Pointers
- 25.15.4.8 VM Exits Induced by VM Entry
- 25.15.4.9 SMI Blocking
- 25.15.4.10 Failures of VM Entries That Return from SMM
- 25.15.5 Enabling the Dual-Monitor Treatment
- 25.15.6 Activating the Dual-Monitor Treatment
- 25.15.7 Deactivating the Dual-Monitor Treatment
- 25.16 SMI and Processor Extended State Management
- Chapter 26 Virtual-Machine Monitor Programming Considerations
- 26.1 VMX System Programming Overview
- 26.2 Supporting Processor Operating Modes in Guest Environments
- 26.3 Managing VMCS Regions and Pointers
- 26.4 Using VMX Instructions
- 26.5 VMM Setup & Tear Down
- 26.6 Preparation and Launching a Virtual Machine
- 26.7 Handling of VM Exits
- 26.8 Multi-Processor Considerations
- 26.9 32-Bit and 64-Bit Guest Environments
- 26.10 Handling Model Specific Registers
- 26.11 Handling Accesses to Control Registers
- 26.12 Performance Considerations
- Chapter 27 Virtualization of System Resources
- 27.1 Overview
- 27.2 Virtualization Support for Debugging Facilities
- 27.3 Memory Virtualization
- 27.4 Microcode Update Facility
- Chapter 28 Handling Boundary Conditions in a Virtual Machine Monitor
- Appendix A Performance-Monitoring Events
- A.1 Architectural Performance-Monitoring Events
- A.2 Performance Monitoring Events for Intel® Intel® Core™i7 Processor Family
- A.3 Performance Monitoring Events for Intel® Xeon® Processor 5200, 5400 Series and Intel® Core™2 Extreme ProcessorS QX 9000 Series
- A.4 Performance Monitoring Events for Intel® Xeon® Processor 3000, 3200, 5100, 5300 Series and Intel® Core™2 Duo ProcessorS
- A.5 Performance Monitoring Events for Intel® Atom™ ProcessorS
- A.6 Performance Monitoring Events for Intel® Core™ Solo and Intel® Core™ Duo ProcessorS
- A.7 Pentium 4 and Intel Xeon Processor Performance-Monitoring Events
- A.8 Performance Monitoring Events for Intel® Pentium® M ProcessorS
- A.9 P6 Family Processor Performance- Monitoring Events
- A.10 Pentium Processor Performance- Monitoring Events
- Appendix B Model-Specific Registers (MSRs)
- B.1 Architectural MSRs
- B.2 MSRs In the Intel® Core™ 2 Processor Family
- B.3 MSRs In the Intel® Atom™ Processor Family
- B.4 MSRs In the Intel® Microarchitecture (Nehalem)
- B.5 MSRs In the Pentium® 4 and Intel® Xeon® Processors
- B.6 MSRs In Intel® Core™ Solo and Intel® Core™ Duo Processors
- B.7 MSRs In the Pentium M Processor
- B.8 MSRs In the P6 Family Processors
- B.9 MSRs in Pentium Processors
- Appendix C MP Initialization For P6 Family Processors
- Appendix D Programming the LINT0 and LINT1 Inputs
- Appendix E Interpreting Machine-Check Error Codes
- E.1 Incremental Decoding Information: Processor Family 06H Machine Error Codes For Machine Check
- E.2 Incremental Decoding Information: Intel Core 2 Processor Family Machine Error Codes For Machine Check
- E.3 Incremental Decoding Information: Processor Family with CPUID DisplayFamily_DisplayModel Signature 06_1AH, Machine Error Codes For Machine Check
- E.4 Incremental Decoding Information: Processor Family 0FH Machine Error Codes For Machine Check
- Appendix F APIC Bus Message Formats
- Appendix G VMX Capability Reporting Facility
- Appendix H Field Encoding in VMCS
- Appendix I VMX Basic Exit Reasons

A-120 Vol. 3
PERFORMANCE-MONITORING EVENTS
Using the Profile-Guided Optimization (PGO)
features of the Intel® C++ compiler may help
reduce branch mispredictions. See the
compiler documentation for more information
on this feature.
To determine the branch misprediction ratio,
divide the BR_INST_RETIRED.MISPRED event
count by the number of
BR_INST_RETIRED.ANY event count. To
determine the number of mispredicted
branches per instruction, divide the number
of mispredicted branches by the
INST_RETIRED.ANY event count. To measure
the impact of the branch mispredictions use
the event
RESOURCE_STALLS.BR_MISS_CLEAR.
Tips
- See the optimization guide for tips on
reducing branch mispredictions.
- PGO's purpose is to have straight line code
for the most frequent execution paths,
reducing branches taken and increasing the
"basic block" size, possibly also reducing the
code footprint or working-set.
C6H 01H CYCLES_INT_M
ASKED.CYCLES_I
NT_MASKED
Cycles during
which interrupts
are disabled
This event counts the number of cycles
during which interrupts are disabled.
C6H 02H CYCLES_INT_M
ASKED.CYCLES_I
NT_PENDING_A
ND_MASKED
Cycles during
which interrupts
are pending and
disabled
This event counts the number of cycles
during which there are pending interrupts but
interrupts are disabled.
C7H 01H SIMD_INST_RET
IRED.PACKED_SI
NGLE
Retired
Streaming SIMD
Extensions
(SSE) packed-
single
instructions
This event counts the number of SSE packed-
single instructions retired.
Table A-7. Non-Architectural Performance Events for Intel Atom Processors
Event
Num.
Umask
Value Event Name Definition Description and Comment