
Intel 64 and IA-32 Architectures Software Developers Manual Volume 3B, System Programming Guide Part 2
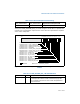
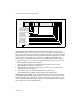
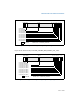
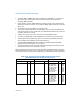
Table Of Contents
- Chapter 18 Debugging and Performance Monitoring
- 18.1 Overview of Debug Support Facilities
- 18.2 Debug Registers
- 18.3 Debug Exceptions
- 18.4 Last Branch Recording Overview
- 18.5 Last Branch, Interrupt, and Exception Recording (Intel® Core™2 Duo and Intel® Atom™ Processor Family)
- 18.6 Last Branch, Interrupt, and Exception Recording (Intel® Core™i7 Processor Family)
- 18.7 Last Branch, Interrupt, and Exception Recording (Processors based on Intel NetBurst® Microarchitecture)
- 18.7.1 CPL-Qualified Branch Trace Mechanism
- 18.7.2 MSR_DEBUGCTLA MSR
- 18.7.3 LBR Stack for Processors Based on Intel NetBurst Microarchitecture
- 18.7.4 Monitoring Branches, Exceptions, and Interrupts
- 18.7.5 Single-Stepping on Branches, Exceptions, and Interrupts
- 18.7.6 Branch Trace Messages
- 18.7.7 Last Exception Records
- 18.7.8 Branch Trace Store (BTS)
- 18.8 Last Branch, Interrupt, and Exception Recording (Intel® Core™ Solo and Intel® Core™ Duo Processors)
- 18.9 Last Branch, Interrupt, and Exception Recording (Pentium M Processors)
- 18.10 Last Branch, Interrupt, and Exception Recording (P6 Family Processors)
- 18.11 Time-Stamp Counter
- 18.12 Performance Monitoring Overview
- 18.13 Architectural Performance Monitoring
- 18.14 Performance Monitoring (Intel® Core™ Solo and Intel® Core™ Duo Processors)
- 18.15 Performance Monitoring (Processors based on Intel® Core™ Microarchitecture)
- 18.16 Performance Monitoring (Processors based on Intel® Atom™ Microarchitecture)
- 18.17 Performance Monitoring for Processors based on Intel® Microarchitecture (Nehalem)
- 18.18 Performance Monitoring (Processors Based on Intel NetBurst microarchitecture)
- 18.18.1 ESCR MSRs
- 18.18.2 Performance Counters
- 18.18.3 CCCR MSRs
- 18.18.4 Debug Store (DS) Mechanism
- 18.18.5 DS Save Area
- 18.18.6 Programming the Performance Counters for Non-Retirement Events
- 18.18.6.1 Selecting Events to Count
- 18.18.6.2 Filtering Events
- 18.18.6.3 Starting Event Counting
- 18.18.6.4 Reading a Performance Counter’s Count
- 18.18.6.5 Halting Event Counting
- 18.18.6.6 Cascading Counters
- 18.18.6.7 EXTENDED CASCADING
- 18.18.6.8 Generating an Interrupt on Overflow
- 18.18.6.9 Counter Usage Guideline
- 18.18.7 At-Retirement Counting
- 18.18.8 Precise Event-Based Sampling (PEBS)
- 18.18.9 Operating System Implications
- 18.19 Performance Monitoring and Intel Hyper- Threading Technology in Processors Based on Intel NetBurst Microarchitecture
- 18.20 Counting Clocks
- 18.21 Performance Monitoring, Branch Profiling and System Events
- 18.22 Performance Monitoring and Dual-Core Technology
- 18.23 Performance Monitoring on 64-bit Intel Xeon Processor MP with Up to 8-MByte L3 Cache
- 18.24 Performance Monitoring on L3 and Caching Bus Controller sub-systems
- 18.25 Performance Monitoring (P6 Family Processor)
- 18.26 Performance Monitoring (Pentium Processors)
- Chapter 19 Introduction to Virtual-Machine Extensions
- Chapter 20 Virtual-Machine Control Structures
- 20.1 Overview
- 20.2 Format of the VMCS Region
- 20.3 Organization of VMCS Data
- 20.4 Guest-State Area
- 20.5 Host-State Area
- 20.6 VM-Execution Control Fields
- 20.6.1 Pin-Based VM-Execution Controls
- 20.6.2 Processor-Based VM-Execution Controls
- 20.6.3 Exception Bitmap
- 20.6.4 I/O-Bitmap Addresses
- 20.6.5 Time-Stamp Counter Offset
- 20.6.6 Guest/Host Masks and Read Shadows for CR0 and CR4
- 20.6.7 CR3-Target Controls
- 20.6.8 Controls for APIC Accesses
- 20.6.9 MSR-Bitmap Address
- 20.6.10 Executive-VMCS Pointer
- 20.6.11 Extended-Page-Table Pointer (EPTP)
- 20.6.12 Virtual-Processor Identifier (VPID)
- 20.7 VM-Exit Control Fields
- 20.8 VM-Entry Control Fields
- 20.9 VM-Exit Information Fields
- 20.10 Software Access to the VMCS and Related Structures
- 20.11 Using VMCLEAR to Initialize a VMCS Region
- Chapter 21 VMX Non-Root Operation
- 21.1 Instructions That Cause VM Exits
- 21.2 APIC-Access VM Exits
- 21.3 Other Causes of VM Exits
- 21.4 Changes to Instruction Behavior in VMX Non- Root Operation
- 21.5 APIC Accesses That Do Not Cause VM Exits
- 21.6 Other Changes in VMX Non-Root Operation
- 21.7 Features Specific to VMX Non-Root Operation
- Chapter 22 VM Entries
- 22.1 Basic VM-Entry Checks
- 22.2 Checks on VMX Controls and Host-State Area
- 22.3 Checking and Loading Guest State
- 22.3.1 Checks on the Guest State Area
- 22.3.1.1 Checks on Guest Control Registers, Debug Registers, and MSRs
- 22.3.1.2 Checks on Guest Segment Registers
- 22.3.1.3 Checks on Guest Descriptor-Table Registers
- 22.3.1.4 Checks on Guest RIP and RFLAGS
- 22.3.1.5 Checks on Guest Non-Register State
- 22.3.1.6 Checks on Guest Page-Directory-Pointer-Table Entries
- 22.3.2 Loading Guest State
- 22.3.3 Clearing Address-Range Monitoring
- 22.3.1 Checks on the Guest State Area
- 22.4 Loading MSRs
- 22.5 Event Injection
- 22.6 Special Features of VM Entry
- 22.6.1 Interruptibility State
- 22.6.2 Activity State
- 22.6.3 Delivery of Pending Debug Exceptions after VM Entry
- 22.6.4 VMX-Preemption Timer
- 22.6.5 Interrupt-Window Exiting
- 22.6.6 NMI-Window Exiting
- 22.6.7 VM Exits Induced by the TPR Shadow
- 22.6.8 Pending MTF VM Exits
- 22.6.9 VM Entries and Advanced Debugging Features
- 22.7 VM-Entry Failures During or After Loading Guest State
- 22.8 Machine Checks During VM Entry
- Chapter 23 VM Exits
- 23.1 Architectural State Before a VM Exit
- 23.2 Recording VM-Exit Information and Updating VM-Entry Control Fields
- 23.3 Saving Guest State
- 23.4 Saving MSRs
- 23.5 Loading Host State
- 23.5.1 Loading Host Control Registers, Debug Registers, MSRs
- 23.5.2 Loading Host Segment and Descriptor-Table Registers
- 23.5.3 Loading Host RIP, RSP, and RFLAGS
- 23.5.4 Checking and Loading Host Page-Directory-Pointer-Table Entries
- 23.5.5 Updating Non-Register State
- 23.5.6 Clearing Address-Range Monitoring
- 23.6 Loading MSRs
- 23.7 VMX Aborts
- 23.8 Machine Check During VM Exit
- Chapter 24 Support for Address Translation
- 24.1 Virtual Processor Identifiers (VPIDs)
- 24.2 Extended Page Tables (EPT)
- 24.3 Caching Translation Information
- Chapter 25 System Management
- 25.1 System Management Mode Overview
- 25.2 System Management Interrupt (SMI)
- 25.3 Switching Between SMM and the Other Processor Operating Modes
- 25.4 SMRAM
- 25.5 SMI Handler Execution Environment
- 25.6 Exceptions and Interrupts Within SMM
- 25.7 Managing Synchronous and Asynchronous System Management Interrupts
- 25.8 NMI Handling While in SMM
- 25.9 SMM Revision Identifier
- 25.10 Auto HALT Restart
- 25.11 SMBASE Relocation
- 25.12 I/O Instruction Restart
- 25.13 SMM Multiple-Processor Considerations
- 25.14 Default Treatment of SMIs and SMM with VMX Operation and SMX Operation
- 25.15 Dual-Monitor Treatment of SMIs and SMM
- 25.15.1 Dual-Monitor Treatment Overview
- 25.15.2 SMM VM Exits
- 25.15.3 Operation of an SMM Monitor
- 25.15.4 VM Entries that Return from SMM
- 25.15.4.1 Checks on the Executive-VMCS Pointer Field
- 25.15.4.2 Checks on VM-Execution Control Fields
- 25.15.4.3 Checks on VM-Entry Control Fields
- 25.15.4.4 Checks on Guest Non-Register State
- 25.15.4.5 Loading Guest State
- 25.15.4.6 VMX-Preemption Timer
- 25.15.4.7 Updating the Current-VMCS and SMM-Transfer VMCS Pointers
- 25.15.4.8 VM Exits Induced by VM Entry
- 25.15.4.9 SMI Blocking
- 25.15.4.10 Failures of VM Entries That Return from SMM
- 25.15.5 Enabling the Dual-Monitor Treatment
- 25.15.6 Activating the Dual-Monitor Treatment
- 25.15.7 Deactivating the Dual-Monitor Treatment
- 25.16 SMI and Processor Extended State Management
- Chapter 26 Virtual-Machine Monitor Programming Considerations
- 26.1 VMX System Programming Overview
- 26.2 Supporting Processor Operating Modes in Guest Environments
- 26.3 Managing VMCS Regions and Pointers
- 26.4 Using VMX Instructions
- 26.5 VMM Setup & Tear Down
- 26.6 Preparation and Launching a Virtual Machine
- 26.7 Handling of VM Exits
- 26.8 Multi-Processor Considerations
- 26.9 32-Bit and 64-Bit Guest Environments
- 26.10 Handling Model Specific Registers
- 26.11 Handling Accesses to Control Registers
- 26.12 Performance Considerations
- Chapter 27 Virtualization of System Resources
- 27.1 Overview
- 27.2 Virtualization Support for Debugging Facilities
- 27.3 Memory Virtualization
- 27.4 Microcode Update Facility
- Chapter 28 Handling Boundary Conditions in a Virtual Machine Monitor
- Appendix A Performance-Monitoring Events
- A.1 Architectural Performance-Monitoring Events
- A.2 Performance Monitoring Events for Intel® Intel® Core™i7 Processor Family
- A.3 Performance Monitoring Events for Intel® Xeon® Processor 5200, 5400 Series and Intel® Core™2 Extreme ProcessorS QX 9000 Series
- A.4 Performance Monitoring Events for Intel® Xeon® Processor 3000, 3200, 5100, 5300 Series and Intel® Core™2 Duo ProcessorS
- A.5 Performance Monitoring Events for Intel® Atom™ ProcessorS
- A.6 Performance Monitoring Events for Intel® Core™ Solo and Intel® Core™ Duo ProcessorS
- A.7 Pentium 4 and Intel Xeon Processor Performance-Monitoring Events
- A.8 Performance Monitoring Events for Intel® Pentium® M ProcessorS
- A.9 P6 Family Processor Performance- Monitoring Events
- A.10 Pentium Processor Performance- Monitoring Events
- Appendix B Model-Specific Registers (MSRs)
- B.1 Architectural MSRs
- B.2 MSRs In the Intel® Core™ 2 Processor Family
- B.3 MSRs In the Intel® Atom™ Processor Family
- B.4 MSRs In the Intel® Microarchitecture (Nehalem)
- B.5 MSRs In the Pentium® 4 and Intel® Xeon® Processors
- B.6 MSRs In Intel® Core™ Solo and Intel® Core™ Duo Processors
- B.7 MSRs In the Pentium M Processor
- B.8 MSRs In the P6 Family Processors
- B.9 MSRs in Pentium Processors
- Appendix C MP Initialization For P6 Family Processors
- Appendix D Programming the LINT0 and LINT1 Inputs
- Appendix E Interpreting Machine-Check Error Codes
- E.1 Incremental Decoding Information: Processor Family 06H Machine Error Codes For Machine Check
- E.2 Incremental Decoding Information: Intel Core 2 Processor Family Machine Error Codes For Machine Check
- E.3 Incremental Decoding Information: Processor Family with CPUID DisplayFamily_DisplayModel Signature 06_1AH, Machine Error Codes For Machine Check
- E.4 Incremental Decoding Information: Processor Family 0FH Machine Error Codes For Machine Check
- Appendix F APIC Bus Message Formats
- Appendix G VMX Capability Reporting Facility
- Appendix H Field Encoding in VMCS
- Appendix I VMX Basic Exit Reasons

Vol. 3 18-81
DEBUGGING AND PERFORMANCE MONITORING
18.17.2 Performance Monitoring Facility in the Uncore
The “uncore” in Intel microarchitecture (Nehalem) refers to subsystems in the phys-
ical processor package that are shared by multiple processor cores. Some of the sub-
systems in the uncore include the L3 cache, Intel QuickPath Interconnect link logic,
and integrated memory controller. The performance monitoring facilities inside the
uncore operates in the same clock domain as the uncore (U-clock domain), which is
usually different from the processor core clock domain.
The performance monitoring facilities available in the U-clock domain consist of:
• Eight General-purpose counters (MSR_UNCORE_PerfCntr0 through
MSR_UNCORE_PerfCntr0). The counters are 48 bits wide. Each counter is
associated with a configuration MSR, MSR_UNCORE_PerfEvtSelx, to specify
event code, event mask and other event qualification fields. A set of global
uncore performance counter enabling/overflow/status control MSRs are also
provided for software.
• Performance monitoring in the uncore provides an address/opcode match MSR
that provides event qualification control based on address value or QPI command
opcode.
• One fixed-function counter, MSR_UNCORE_FixedCntr0. The fixed-function
uncore counter increments at the rate of the U-clock when enabled.
The frequency of the uncore clock domain can be determined from the uncore
clock ratio which is available in the PCI configuration space register at offset C0H
under device number 0 and Function 0.
18.17.2.1 Uncore Performance Monitoring Management Facility
MSR_UNCORE_PERF_GLOBAL_CTRL provides bit fields to enable/disable general-
purpose and fixed-function counters in the uncore. Figure 18-29 shows the layout of
MSR_UNCORE_PERF_GLOBAL_CTRL for an uncore that is shared by four processor
cores in a physical package.
• EN_PCn (bit n, n = 0, 7): When set, enables counting for the general-purpose
uncore counter MSR_UNCORE_PerfCntr n.
• EN_FC0 (bit 32): When set, enables counting for the fixed-function uncore
counter MSR_UNCORE_FixedCntr0.
• EN_PMI_COREn (bit n, n = 0, 3 if four cores are present): When set, processor
core n is programmed to receive an interrupt signal from any interrupt enabled
uncore counter. PMI delivery due to an uncore counter overflow is enabled by
setting IA32_DEBUG_CTL.Offcore_PMI_EN to 1.
• PMI_FRZ (bit 63): When set, all U-clock uncore counters are disabled when any
one of them signals a performance interrupt. Software must explicitly re-enable
the counter by setting the enable bits in MSR_UNCORE_PERF_GLOBAL_CTRL
upon exit from the ISR.