
Voltage Regulator-Down (VRD) 10.1 Design Guide


Electrical Simulation
R
Design Guide
67
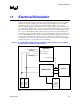
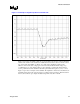
Figure 11-2. Example Voltage Droop Observed at Node ‘N2’
Figure 11-2 provides an example voltage droop waveform at node ‘N2’, the socket-motherboard
interface. The load line value is defined as
∆V/∆I with ∆V measured at this node and the current
step observed through I_PWL (see Figure 11-7). The voltage amplitude is defined as the
difference in the steady state voltage (prior to the transient) and the minimum voltage droop
(consult Figure 11-2). Care must be taken to remove all ripple content in this measurement to
avoid a pessimistic load line calculation that will require additional capacitors (cost) to correct.
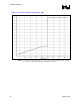
Figure 11-3provides an example current stimulus. The amplitude is measured as the difference in
maximum current and steady state current prior to initiation of the current step. With
∆V and ∆I
known, the load line slope is simply calculated using Ohm’s Law: R
LL
= ∆V/∆I.