
User Guide

Intel® Integrated BMC Web Console Options Intel® BMC And RMM4 User Guide
72 Intel order number H54847-001 Revision 2.8
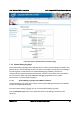
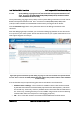
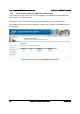
After the debug log dump is finished, you can click the debug log filename to save the results
as a .zip file on your client system. The file can then be sent to your system manufacturer or an
Intel
support engineer for analysis.
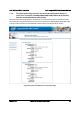
Figure 65: System Information System Debug Log Page on S1200BTL Platforms
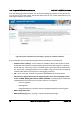
A list of data that may be captured using this feature includes but is not limited to:
• Platform sensor readings – This includes all “readable” sensors that can be accessed
by the BMC FW and have associated SDRs populated in the SDR repository. This does
not include any “event-only” sensors. (All BIOS sensors and some BMC and ME sensors
are “event-only”, meaning that they are not readable using an IPMI Get Sensor Reading
command but rather are used just for event logging purposes.)
• SEL – The current SEL contents are saved in both hexadecimal and text format.
• CPU/memory register data useful for diagnosing the cause of the following system
errors: CATERR, ERR[2], SMI timeout, PERR, and SERR – The debug data is saved and
timestamped for the last three occurrences of the error conditions.
o PCI error registers
o MSR registers
o Integrated Memory Controller (iMC) and Integrated I/O (IIO) module registers
• BMC configuration data
• BMC FW debug log (that is, SysLog) – Captures FW debug messages.