
User Guide

Intel
®
System Event Log (SEL) Viewer Utility User Guide
5
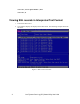
The EFI based SEL Viewer’s main window is based on a multi-column display pane as shown in
Figure 1. It displays all the SEL records and a pull-down menu used for selecting the main
functions available in the utility.
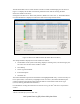
See Figure 2 for SEL Viewer Main Utility Window (Windows & Linux OSes *). The default format
in which information is displayed in interactive mode is the interpreted text format.
Figure 2: SEL Viewer Main Window (Windows & Linux OSes*)
The interpreted data is displayed in several columns as follows:
Serial number of the system events being displayed. Starting with 1, and increasing by one
for each event. The title of this column is “Num”.
Time Stamp.
Sensor Type and Number.
Event Description
1
Generator ID.
The bottom information pane shows the details on the highlighted SEL entry. Use the arrow keys to
move up and down, or the Tab key to highlight a menu. In Linux*, the bottom information pane
contains a statistics panel which holds a statistical table of events based on their Event Type
(Critical, Warning, Informational and Others).
For information on using the menu items see section Viewing the Intel
®
SEL Viewer Information
window.
1
Based on the IPMI Specification, BIOS EPS