
User
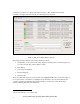
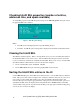

See Figure 4 for SEL Viewer Main Utility Window (Linux*). The default format in which
information is displayed in interactive mode is the interpreted text format.
Figure 4: SEL Viewer Main Window (Linux*)
The interpreted data is displayed in several columns as follows:
• Serial number of the system events being displayed. Starting with 1, and increasing by one
for each event. The title of this column is “Num”.
• Time Stamp.
• Sensor Type and Number.
• Event Description
1
• Generator ID.
The bottom information pane shows the details on the highlighted SEL entry. Use the arrow keys to
move up and down, or the Tab key to highlight a menu. In Linux*, the bottom information pane
contains a statistics panel which holds a statistical table of events based on their Event Type
(Critical, Warning, Informational and Others).
1
Based on the IPMI Specification, BIOS EPS
Intel® System Event Log (SEL) Viewer Utility User Guide
8