2x2 UBR user manual using GUI 11.5.1.
x2 UBR user manual using GUI Callout 9. Name Guard Interval Revision: A0-07 Description Uplink = 80% of the total available bandwidth is used in uplink This parameter will be in sync with the linked master device Click “Save” to save the Link settings or click “Reset” to configure the same again.
2x2 UBR user manual using GUI 11.5.2 Revision: A0-07 Link Security Settings Link security depends on the type of security protocol applied to your wireless network. The security protocol encrypts data transmissions and ensures that only trusted devices receive authorization to connect to your network. WPA2 is the most secure protocol and recommended for better security of your wireless network.
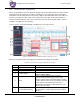
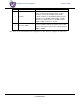
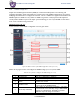
2x2 UBR user manual using GUI 11.5.3 Revision: A0-07 Advanced Settings A basic overview of the advanced TDMA settings screen is given below: Figure 34: Basic overview of the advanced TDMA settings screen Caution: Misconfiguration might leads to permanent link failure Follow the steps given below and configure the advanced TDMA settings for the UBR: Table 28: List of actions to configure the advanced TDMA settings for the UBR Callout Name Description 1. 2. 3.
2x2 UBR user manual using GUI 11.5.4 Revision: A0-07 Redundant Link Switching This screen provides options to comply with 1+1 switching feature. An ERPS switch is used between two established links. One link is set to primary which is used in ideal cases and the other behaves as secondary which comes online whenever the primary link is broken or down.
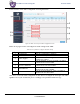
2x2 UBR user manual using GUI 11.6 Revision: A0-07 Backhaul Radio Configuration This screen provides the user with options to configure the backhaul radio parameters such as channel bandwidth, respective channel or the channel selection process, and the power for the radio signal transmission. The backhaul portion of the network comprises the intermediate links between the core network, or backbone network, and the small subnetworks at the "edge" of the entire hierarchical network.
2x2 UBR user manual using GUI Callout Name 7. Channel 8. Tx Power (dBm) Revision: A0-07 Description Select the “Channel” from the dropdown list. The device will choose the channel by itself, if “auto” channel is selected. For 20 MHz channel width, available channels are: 36/40/44/48/149/153/157/161/ 165/169/173. For 40 MHz channel width, available channels are: 38/46/151/159. For 80 MHz channel width, available channels are: 42/155 Enter the “Tx Power” value.
2x2 UBR user manual using GUI 11.7 Revision: A0-07 ATPC Configuration ATPC stands for Adaptive Transmission Power Control. This feature of UBR GUI enables the device to vary the power of transmitted signal to match the signal power of receiving end during “Fade” conditions (Reduced RSSI) such as heavy rainfall. ATPC can be used separately to ACM or together to maximize link uptime, stability, and availability.
2x2 UBR user manual using GUI Revision: A0-07 A basic overview of the ATPC Configuration screen is given below: Figure 37: Basic overview of the ATPC Configuration screen Follow the steps given below and configure the ATPC settings for the UBR: Table 31: List of actions to configure the ATPC settings Callout Name Description 1. 2. Configuration ATPC 3. ATPC Support 4. Tx Power Minimum 5. Tx Power Maximum 6. RSSI Minimum 7.
2x2 UBR user manual using GUI 11.8 Revision: A0-07 SNMP Configuration Simple Network Management Protocol (SNMP) is an Internet Standard protocol for collecting and organizing information about managed devices on IP networks. The SNMP configuration is also used for modifying that information to change device behavior. The ion’s UBR device supports both SNMPv2 and SNMPv3 protocol. SNMP v3 is very similar to SNMP v2 (previous version) apart from the improved security model.
2x2 UBR user manual using GUI Callout Name 6. Read-Write Community 7. Trap Community 8. Trap Host IP 9. Trap Host Port Revision: A0-07 Description Enter a string for “Read-Write Community”. The same is matched with write community string of EMS SNMP template for authentication. The EMS can write the UBR data only if the strings are matched Enter a string for “trap Community”. The same is matched with trap community string of EMS SNMP template for authentication.
2x2 UBR user manual using GUI Revision: A0-07 SNMP Version-v3: A basic overview of the SNMP Configuration screen is given below: Figure 39: Basic overview of the SNMP Configuration screen (v3) Follow the steps given below and configure the SNMP settings (v3) for the UBR: Table 33: List of actions to configure the SNMP settings (v3) Callout Name Description 1. 2. Configuration SNMP Configuration 3. Status 4. SNMP Version 5. SNMPv3 User Name 6.
2x2 UBR user manual using GUI Callout Name 7. Authentication Method 8. Authentication Password 9. Encryption 10. Privacy Key 11. User Access Privilege 12. Trap Host IP 13. Trap Host Port Revision: A0-07 Description 2. Only “User Access Privilege” parameter is needed in case of “No Authentication/Privacy” type of security level. 3.
2x2 UBR user manual using GUI 11.9 Revision: A0-07 Alarms Configuration The user can configure the traps for the respective UBR from this screen. The enabled traps are shown as notifications in the Overview toolbar on the top and will be sent to EMS as traps through SNMP settings. The Alarm screen is further categorized into following sections: 1. 2. 3. 4. Link/Interface Alarms System Alarms SNMP Alarms Alarms Settings 11.9.
2x2 UBR user manual using GUI Callout Name 7. Wi-Fi up 8. Wi-Fi down 9. Ethernet Up 10. Ethernet Down 11. Link Password Change 12. Chain Disconnect 13. Chain Disconnect Clear Revision: A0-07 Description same. If “Link down” alarm is enabled, set the severity level to Critical, Major, Minor, or Info Enable/Disable the “Wi-Fi up” alarm option. If enabled, the notification of Wi-Fi up will be shown at local GUI and the trap will be sent to the EMS for the same.
2x2 UBR user manual using GUI 11.9.2 Revision: A0-07 System Alarms A basic overview of the Alarm Configuration screen to configure system alarms is given below: Figure 41: Basic overview of the Alarm Configuration screen to configure system alarms Follow the steps given below and configure the system alarms for the UBR: Table 35: List of actions to configure system Alarms Callout Name Description 1. 2. 3. Configuration Event Alarm System Alarms 4. Select All Alarms 5. CPU Overload 6.
2x2 UBR user manual using GUI Callout Name 9. Memory Overload Clear 10. Memory Threshold 11. GPS Not Locked 12. GPS Locked 13. System Reboot Revision: A0-07 Description EMS for the same, once it has gone above the “Memory Threshold” value. Set the severity level to Critical, Major, Minor, or Info Enable/Disable the “Memory Overload Clear” option. The memory clear load is determined with respect to the selected “Memory Threshold”.
2x2 UBR user manual using GUI 11.9.4 Revision: A0-07 EMS Alarms A basic overview of the Alarm Configuration screen to configure EMS alarms is given below: Figure 42: Basic overview of the Alarm Configuration screen to configure EMS alarms Follow the steps given below and configure the EMS alarms for the UBR: Table 36: List of actions to configure EMS Alarms Callout Name Description 1. 2. 3. Configuration Alarms EMS Alarms 4. Select All Alarms 5. Firmware Upgrade Success 6.
2x2 UBR user manual using GUI Callout Name 9. Restore Configuration Success 10. Restore Configuration Fail Revision: A0-07 Description shown at local GUI whenever the respective UBR device has failed to generate backup, and the trap is sent to the EMS for the same. Set the severity level to Critical, Major, Minor, or Info Enable/Disable the “Restore Configuration Success” alarm option.
2x2 UBR user manual using GUI 11.10 Revision: A0-07 Syslog Configuration Logs relevant to the UBR application software are displayed in the Diagnostic/System Log screen for monitoring purpose. The same can be uploaded to an external server and the configuration for the same is performed in this screen. Event messages or corresponding messages are sent to the logging server based on the configured log level.
2x2 UBR user manual using GUI 11.11 Revision: A0-07 Configuration of traffic management (Quality of Service) Quality of service (QoS) involves controlling and managing network traffic by setting priorities for specific types of data (background, best effort, video, and audio traffic) on the network. IEEE P802.1p is the name of a task group that provides a mechanism for implementing quality of service (QoS) at the media access control (MAC) level.
2x2 UBR user manual using GUI Callout Revision: A0-07 Name Description 4. Confirm QoS Policy switching 5. Default VLAN Priority DSCP QoS with Default Policy/ DSCP QoS with Custom Policy) Click on “Confirm Qos Policy” option to change the QoS policy Displays the default VLAN priority for voice, video, best effort, and background traffic queues Refer the above figure to check the priority levels for voice, video, best effort, and background traffic queues.
2x2 UBR user manual using GUI 11.11.2 Revision: A0-07 VLAN QoS with Custom Policy A basic overview of the VLAN QoS Configuration screen with custom policy is given below: Figure 45: Basic overview of the VLAN QoS Configuration screen with custom policy Follow the steps given below and configure the VLAN QoS with custom policy for the UBR: Table 39: List of actions to configure the VLAN QoS with custom policy Callout Name Description 1. 2. Configuration QoS 3.
2x2 UBR user manual using GUI 11.11.3 Revision: A0-07 DSCP QoS with Default Policy A basic overview of the DSCP QoS Configuration screen with default policy is given below: Figure 46: Basic overview of the DSCP QoS Configuration screen with default policy Follow the steps given below and configure the DSCP QoS with default policy for the UBR: Table 40: List of actions to configure the DSCP QoS with default policy Callout Name Description 1. 2. Configuration QoS 3. QoS Policy 4.
2x2 UBR user manual using GUI 11.11.4 Revision: A0-07 DSCP QoS with Custom Policy A basic overview of the DSCP QoS Configuration screen with custom policy is given below: Figure 47: Basic overview of the DSCP QoS Configuration screen with custom policy Follow the steps given below and configure the DSCP QoS with custom policy for the UBR: Table 41: List of actions to configure the DSCP QoS with custom policy Callout Name Description 1. 2. Configuration QoS 3.
2x2 UBR user manual using GUI Revision: A0-07 12 User Management The UBR GUI is designed with options to add multiple users. Added users can be configured with different access capabilities. The admin can add a new user, delete the existing one, and can even change the user’s access to maintenance, configuration, and diagnostics screens or their further options.
2x2 UBR user manual using GUI 12.1 Revision: A0-07 Add a new User Refer “Figure 48: Basic overview of user configuration screen” and click on “Add” option (6).
2x2 UBR user manual using GUI Callout Name Enable Configuration Menu 6. Revision: A0-07 Description “User Access Configuration to Maintenance screen options” for more details This check box is provided to allow or restrict the user to access configuration screen and its features. Click and select the check box to allow the user to access the configuration screen or uncheck the box to restrict the user from accessing the same.
2x2 UBR user manual using GUI Callout Name 2. Allow Access 3. Restrict Access Revision: A0-07 Description Click on the check box and select options available in diagnostics screen. The respective user will have access to selected screens Click on the check box and deselect options available in diagnostics screen. The respective user will not have access to selected screens Click “Save” to save the user configuration or click “Reset” to configure the same again.
2x2 UBR user manual using GUI 12.1.2 Revision: A0-07 User Access Configuration to Maintenance screen options This screen provides the user with options to further manage the access privileges of a newly added user to maintenance screen options, if the respective user has been configured with access to maintenance screen. Refer “Figure 49: Basic overview of user configuration parameters” and click on “Maintenance Menu” tab (5) located on top.
2x2 UBR user manual using GUI 12.1.3 Revision: A0-07 User Access Configuration to Configuration screen options This screen provides the user with options to further manage the access privileges of a newly added user to configuration screen options, if the respective user has been configured with access to configuration screen. Refer “Figure 49: Basic overview of user configuration parameters” and click on “Configuration Menu” tab (6).
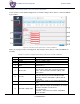
2x2 UBR user manual using GUI Revision: A0-07 13 Monitor screen The performance of the connected UBR is monitored from this screen. The list of options available for the user is given below: 1. 2. 3. 4. 5. 13.1 Real-time Real-time Real-time Real-time Real-time Graphs/Load Graphs/Traffic Graphs/Signal & Noise Graphs/Channel Interference Graphs/Tx Power Real-time Graphs/Load The real time load graph shows the CPU load of last 3 min and the graph is refreshed at every 3 sec interval.
2x2 UBR user manual using GUI 13.2 Revision: A0-07 Real-time Graphs/Traffic The real time traffic graph shows the traffic at backhaul interface, LAN interface and at Ethernet interface in last 3 min. The graph is refreshed at every 3 sec interval. In addition to the displayed graph the user can find the inbound and outbound traffic along with average and the peak traffic values of the respective UBR.
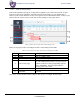
2x2 UBR user manual using GUI 13.3 Revision: A0-07 Real-time Graphs/Signal & Noise The graph shows the wireless signal and noise status to explain the real-time wireless status in last 3 minutes. The graph is refreshed at every 3 sec interval. In addition to the displayed graph the user can find the signal and noise values along with average and the peak values of the respective UBR.
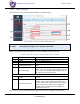
2x2 UBR user manual using GUI 13.4 Revision: A0-07 Real-time Graphs/Channel Interference The graph shows the real-time channel interference. A basic overview of the screen is given below: Figure 56: Basic overview of the Real-time Graphs/Tx Channel Interference screen Follow the steps given below to view the real-time channel interference graphs for the UBR: Table 50: List of actions to view real-time channel interference graphs Callout 1. 2. 3. 4.
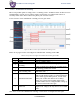
2x2 UBR user manual using GUI 13.5 Revision: A0-07 Real-time Graphs/Tx Power The graph shows the real-time Tx power status of transmitted signal in last 3 minutes. The graph is refreshed at every 3 sec interval. A basic overview of the Real-time Graphs/Tx Power screen is given below: Figure 57: Basic overview of the Real-time Graphs/Tx Power screen Follow the steps given below to view the real-time Tx Power graphs for the UBR: Table 51: List of actions to view real-time Tx Power graphs Callout 1. 2.
2x2 UBR user manual using GUI Revision: A0-07 14 Diagnostics screen The diagnostic activities of the connected UBR are executed from this screen. The list of options available for the user is given below: 1. 2. 3. 4. 14.1 System Log Kernel Log Diagnostic Tools Debug logs System Log The size of the log displayed in system log screen is based on the “System log buffer size” limit specified in the syslog configuration screen.
2x2 UBR user manual using GUI 14.2 Revision: A0-07 Kernel Log Boot logs, driver logs, Wi-Fi and firmware related logs are listed in this screen. Kernel log will be accumulated from boot up time till shut down time of the respective UBR. A basic overview of the Kernel Log screen is given below: Figure 59: Basic overview of the Kernel Log screen Follow the steps given below to view the Kernel log for the UBR: Table 53: List of actions to view the kernel log Callout 1. 2.
2x2 UBR user manual using GUI 14.3 Revision: A0-07 Diagnostic Tools As part of diagnostics, the user can perform the following activities: 1. The user can check if the link connection is established or not with “Ping” option 2. The user can trace the route of the established link with “Traceroute” option 3. The user can look for the server address with the help of domain name by using “Nslookup” option 14.3.
2x2 UBR user manual using GUI 14.3.2 Revision: A0-07 Check the route of the established network connection A basic overview of the Diagnostic Tools screen to check the route of established connection is given below: Figure 61: Basic overview of the diagnostics tool screen to check the route of established connection Follow the steps given below to check the route of established connection: Table 55: List of actions to check the route of established connection Callout Name Description 1. 2.
2x2 UBR user manual using GUI 14.3.3 Revision: A0-07 Identify the IP address with the domain name A basic overview of the Diagnostic Tools screen to identify the IP address with the domain name is given below: Figure 62: Basic overview of the diagnostics tool screen to identify the IP address with the domain name Follow the steps given below to identify the IP address with the domain name: Table 56: List of actions to identify the IP address with the domain name Callout Name Description 1. 2. 3.
2x2 UBR user manual using GUI 14.4 Revision: A0-07 Debug logs The user can view and download the debugging information such as logs and configuration with the help of this feature. It helps the user to analyze and understand the root cause of any system failure.
2x2 UBR user manual using GUI Revision: A0-07 15 Alarms This screen displays the active/info/historical alarms in a listed form along with the relevant information in the respective columns. The bell icon in Overview toolbar on the top will show the total number of unacknowledged alarms. The user is provided with options to acknowledge and delete the raised alarms in this screen. 15.1 Active Alarms The alarms which are having significant positive or negative event are listed in this screen e.g.
2x2 UBR user manual using GUI Revision: A0-07 Follow the steps given below to view the active alarm listing and statistics: Table 58: List of actions to view the active alarm listing and statistics Callout Name Description 1. 2. Alarms Active Alarms 3. Alarms Statistics 4. Alarms Listing 5. Acknowledge Alarm 6. Delete Click on “Alarms” dropdown Click on “Active Alarms” option Displays total count of the acknowledged, unacknowledged, and other active alarms based on their severity level.
2x2 UBR user manual using GUI 15.2 Revision: A0-07 Historical Alarms All alarms which have been cleared from active alarm page are displayed in this screen. The user can acknowledge any of the alarm or can delete the same from this screen, if needed.
2x2 UBR user manual using GUI Revision: A0-07 16 Logout The user can click on the “logout” option to terminate the session as shown in the figure below: Figure 66: Basic overview of the UBR GUI with logout option Once logged out the user will be presented with the login screen.
2x2 UBR user manual using GUI Revision: A0-07 17 Installation Setup 2x2 UBR has four holes on its back side for the attachment of mounting bracket, as shown in “Figure 3: Back view of the 2x2 UBR” of this document. The mounting bracket is designed in such a way that the UBR can be mounted on the wall as well as on the pole with the help of its attaching parts. It provides the freedom of movement to the UBR even after the mounting. 1.
2x2 UBR user manual using GUI Revision: A0-07 2. Final alignment of the mounting bracket with UBR is as shown below: Figure 68: Mounting bracket alignment with the 2x2 UBR device The mounting instructions of 2x2 UBR is detailed in further sections below.