
manual

11
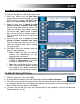
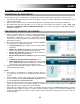
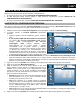
VIEW YOUR DATA IN A TABLE
To view your readings in a table, follow these steps:
1. Place your mouse over the Data Menu
(paper/gear icon) and select which data you
want to view in a table – BP Data (blood
pressure) or Thermometer (temperature).
2. Check the box next to Select the date
interval or Select a specific date range.
Click the drop-down menu(s) next to it to
select the range of dates whose readings
you want to view. (When setting a specific
date, you can jump to a different month or
year by clicking on them at the top of the
calendar.)
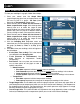
3. Check the box next to Select the time
interval or Select a specific time range.
Click the drop-down menu(s) next to it to
select the range of times whose readings
you want to view.
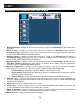
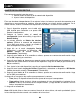
4. Click OK to view your readings, which will
appear in the table below.
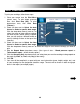
• Date / Time: The date and time the
reading was downloaded to your
computer from your device.
• Systolic Pressure / Diastolic Pressure
/ Pulse or Thermometer: Your blood
pressure or temperature reading.
• Note: You can double-click this column
and a new window will appear, allowing
you to type in any additional information
you would like to store with this reading.
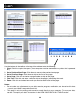
TO EXPORT DATA (OPTIONAL)
1. Click the "paper/star" icon (next to OK).
2. In the window that appears, click the large white field under Export File Name.
3. You will be asked to select a location to save the file and the file name. (We recommend saving it
to someplace obvious like your Desktop and naming it with the date so you can keep track of it
easily.) When you have done so, click Save.
4. To access the file with your data, go to that location on your computer. You can use Microsoft
Excel to open the .csv file.