User Guide
© Ionic Information Ltd. 1997-2006 All rights reserved. This guide and the program are copyright works of Ionic Information Limited, London, England and are licensed in terms of our standard contract. The data referred to herein is the copyright of the London Stock Exchange, Hemscott PLC, FTSE, AFX News and others. Reproduction in whole or in part without the express written permission of Ionic Information Limited is prohibited. Reverse engineering is also prohibited.
Contents 1. How to Use This Guide 3 2. Financial Background and Terminology 5 3. Intraday Information 7 4. Windows 11 5. Intraday Graph Window 13 6. List Window 21 7. Ticker 27 8. Intraday Alarms 31 9. Trades and Quotes List 37 10. Messaging 39 11.
Page 2
1. How to Use This Guide This guide explains how to use the extra features available in ShareScope Plus and Pro. It is intended to be used in addition to the ShareScope User Guide, which details the features that are common to all ShareScope programs. The features described in this guide are generally common to both Plus and Pro, but in some instances, a feature may be exclusive to ShareScope Pro. The text will always clearly identify any such instances.
Page 4
2. Financial Background and Terminology Intraday Data London Stock Exchange (LSE) and FTSE supply real time prices for UK listed shares and FTSE indices in ShareScope Pro. The data is delayed by 15 minutes in ShareScope Plus. All of ShareScope’s US data (NASDAQ, NYSE, AMEX) and many international indices (CAC, DAX, S&P 500 and Dow Jones) are supplied by Comstock, a division of Interactive Data Corporation (NYSE: IDC). Comstock is a leading provider of market data solutions to the global financial community.
Terminology SETS Most liquid LSE stocks. SEAQ Less liquid LSE stocks. Mid Average of the bid and offer. Open The first ‘reliable’ price for the day. LSE SETS: The first uncrossing price or, failing that, first automatic trade. LSE SEAQ: Mid price when the market opens. Other markets: First Trade FTSE 100, 250, 350 & SmallCap indices: Value three minutes after the open. Other Indices: First quote. High LSE SETS: Highest trade during market hours. LSE SEAQ: Highest mid price during market hours.
3. Intraday Information Intraday Data ShareScope Pro will give you up-to-the-second information on: Prices and volume for all UK equities and investment trusts listed on the London Stock Exchange (LSE), the Alternative Investment Market (AIM), US equities listed on NASDAQ, the New York Stock Exchange (NYSE), the American Stock Exchange (AMEX), international indices (S&P 500, Dow Jones, CAC, DAX and most FTSE indices), Foreign Exchange (FOREX) and AFX News.
Max receives all available data (including prices, trades and volume) for the selected feed in real time. Normal will display snapshots of fifteen seconds including mid price movements and cumulative volume. Minimal will display snapshots of one minute including mid price movements and cumulative volume. None will switch off data supply for the selected feed.
Once a connection is made, the dialog box will automatically close and you will be connected. To connect automatically every time the program is opened, you need to select Tools : Options... : Intraday Feed and then select Auto connect to the feed. Connection status is shown in the bottom right-hand corner of the screen. A standard internet connection is required when connecting to our intraday feed. You will need to establish your internet connection before connecting to our intraday servers.
Intraday Price History Should you wish to recover data from previous days you can backfill the intraday history, this will enable you to see intraday graphs for previous days. You can download, or backfill, up to four weeks (20 trading days) of data. To do this, select Update : Backfill intraday history... When the dialog box appears, choose the exchanges required from the tick boxes and select the dates you wish to backfill, then press Request.
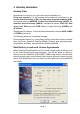
4. Windows ShareScope Plus and Pro allow users to view multiple windows at one time. With multiple window viewing, there is no limit to how many windows you can to add to your screen. The diagram below illustrates multiple windows in ShareScope Pro. Linking Windows All graph and list windows can be linked, giving you multiple information displays for one share.
To unlink a window, right click on the title bar and from the context menu that appears select Unlink window. Adding and Re-sizing Windows To create a new window, select Window : New window. Select the type of new window you require from the sub-menu that appears. Alternatively, you can right click on the screen and select New window from the context menu that appears. All windows displayed in ShareScope Plus and Pro can be re-sized to your exact requirements.
5. Intraday Graph Window To view the intraday graph window if it is not already showing on your screen, select Window : New Window : Intraday graph. The intraday graph window will initially display the current day’s trades along with the bid and offer price. The shaded area of the window below the trades line represents the bid price. The shaded area of the window above the trades line represents the offer price. Trades are represented as coloured dots.
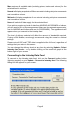
Context Menu Right click over the intraday graph window to reveal the graph window context menu, which offers you the following options. Graph Design By selecting Graph Design… from the context menu, a dialog box will appear, as shown on the opposite page. At the top of the graph design dialog box is the De-spike slider. From time to time rogue trades will appear in the form of an unusually high or low price. This is often an error from a broker mis-entering a trade on their screen.
The Library facility allows you to save and restore individual graph settings which can be easily exchanged with other ShareScope users. To save a graph setting, click on the Library button and select Add current settings to library. You can then name and save this setting in your Library folder or save to another location. To restore a graph setting at a later date, click on the Library tab and select from the list or choose Open library folder....
Show opening price will display the day’s opening price on the left-hand vertical axis of the graph. Previous day’s high/low/close will overlay the previous day’s high, low or closing price as a horizontal line on each day of the intraday chart. ShareScope will get prices from the historical price database. If this is not available (e.g. the historical data has not been updated or is not available for that share), then your intraday data will be used as a source instead.
The following three time scale options are available: Show all data will display all trades over a twenty four hour period, including trades outside of trading hours. Market hours will display trading hours only (this will vary depending on the exchange that the share is listed on). User defined hours lets you choose the period that you want to see (this can be useful to eliminate trading spikes caused by opening and closing auctions).
Analytics Tab The calculation of analytics can be edited on an intraday graph when two or more day’s history is displayed. If you select the Use all data radio button, this will use all available data for each day. This includes price movements outside of normal market hours. If the Use Graph time radio button has been selected the Analytics will be calculated using trading hours only. To define your own set period, select the User defined radio button and specify the required times from the adjacent boxes.
Lines You can add lines to the intraday graph window by selecting Lines & Text from the context menu, or using Shift and dragging with the left mouse button just as you can on your historical graph. Using right shift and left click adds a horizontal line starting from the cursor. Under the Lines & Text sub menu there is also a choice of line studies available. These include Fibonacci Arc, Fibonacci Fan, Fibonacci Retracement, Gann Angles and Speed Resistance Lines.
Page 20
6. List Window ShareScope Plus and Pro list windows have several important extra features and functions. When you are connected to the intraday feed, incoming prices flash in the window as data is received. As the default setting, intraday prices will flash green when a price has risen, yellow if the price stays the same, and red if the price drops. Prices can be displayed in pounds or pence with up to three decimal places: right click over any price column heading (mid, bid or trade etc.
Context Menu Right click in the list window to view the context menu: List Design By selecting List design… from this menu, you can design the layout of your ShareScope Plus or Pro list window (see the dialog box on opposite page). On the left of the list design dialog box is the Wrap Columns (if possible) option. If you were looking at a list of FTSE 100 shares, showing the name and mid price columns only, you would see a large gap to the right of the columns.
The Text tab lets you change the colour of the text and background within the list window. Click on the colour box next to any of the options listed and select the colour you want to use. The Colours tab offers options to edit the appearance of the list window. You can alter the colour of the Vertical and Horizontal lines as they appear in the list screen. The Arrows options allow you to change the colour of the Up, Down and Same directional arrows.
Adding Intraday Columns ShareScope Plus and Pro allow you to display many columns that are designed specifically for intraday data. To select these columns place the mouse pointer over the grey column heading area and right click. You will see the following menu: On selecting Add Intraday Column… from this list, you will be given the following options: All the headings that you see in the dialog box can be added as columns in the list screen and updated intraday.
The choices on the Prices tab allow you to create custom columns based upon the bid and offer prices. For example, if you select Mid bid/offer as the Price, Price as the Price Type, and Latest Value as the Value, you will see today’s latest mid price value. Time shows the time when the bid and offer were last updated. The various options are dynamic and will change depending upon your selection.
These include: Graph The mid price graph for the current day. Spread graph Graph of the spread value between the bid price and offer price. Tick changes Shows trade ticks by either increase or decrease. Thermograph Bar chart showing the changes to the mid price over time. Buy sell bar Bar chart displaying the day’s trades as buys, sells or unknowns. This information is inferred from the price of the trade and the bid/offer price at the time of the trade. The fourth tab is Open / Close.
7. Ticker The ticker is a rolling window that displays trades and index values. If it is not showing on your screen, you can activate it by selecting Window : New window : Ticker. The information can be displayed in a variety of styles. Above you can see an example of a vertical scrolling ticker. Each line shows the price, volume, price change since open and the percentage change since open for the given share. Positioning the ticker gives you the flexibility to have it displayed anywhere on your screen.
Price Ticker Display You can adjust the information and display of the price ticker window by right clicking over the ticker and selecting Ticker design…. You can also select Ticker : Ticker design… when the ticker window is selected. In the ticker design dialog box that appears, you have a number of options from which to choose, enabling you to set the price ticker to display exactly the information you want to see. At the top are the Speed settings, the first being Variable speed.
The Display details options allow you to add or remove display details such as Time, EPIC, Name, Price, and Volume by ticking or un-ticking in the box next to each item. You can also choose Price change since open (absolute change in value from open), Price % change since open (percentage change in value from open), Price change since close (absolute change in value from previous close), and Price % change since close (percentage change in value since previous close).
To the right of the options are the colour and font selection buttons. This gives you the opportunity to highlight companies from specific groups of shares. For example, to make FTSE 100 shares stand out from any other shares, simply click on the Abc button next to FTSE 100, change the colour choice for the background to yellow and click OK. ShareScope will then display all shares from the FTSE 100 with a yellow background.
8. Intraday Alarms Setting and Adjusting Individual Share Alarms Alarms can be added to individual shares and monitored intraday. Highlight a share and select Edit : Intraday alarms. This will bring up a sub-menu with four options, the first being Edit alarms for [share name]. Select this and you will see the following dialog box.
ShareScope will always show you the share name and its current price at the top left of the dialog box. This will be the current intraday mid price. Just beneath the current price, you can select a Fixed price increase or decrease. Tick the relevant box and then type in the increase/decrease figure to the right. If the mid price moves above or below your fixed price options, an alarm will be triggered. Beneath this, you can set Percentage increase in price or Percentage decrease in price alarms.
Adding Global Alarms As well as setting alarms for individual shares, alerts can also be set for groups of shares. These are known as global alarms. Global alarms can be added by selecting Edit : Intraday alarms : Edit global alarms. A dialog box (below) will appear that allows you to set intraday global alarms. At the top of this menu, there is a Source option to choose the required data source. You can choose between Shares (equities only), FTSE 100 (FTSE 100 only), or Other.
By ticking Check for golden crosses under the Moving Average tab for example, you will activate the moving average alarm. Once activated, type in the number of intervals required (one for the Short MA interval count and one for the Long MA interval count). ShareScope will now search your selected source for any shares which cross in the two moving average periods selected.
Limit alarms to last X minutes allows you to limit the period of time ShareScope will check back for triggered alarms. Once ticked, enter the required time period to be checked. Triggered Alarms At the bottom of the Triggered Alarms dialog box there are four different buttons. Alarm Options This allows you to review and edit your alarm settings in the same way as you can set alarm functions by selecting Tools : Options : Intraday alarms.
Page 36
9. Trades and Quotes List The Trades and quotes list allows you to view all the trade and price movements for a share during the current trading day. Select Window : New Window : Trades and quotes. To view a list of Trades and quotes for a particular share, you can either use the Find A Share function (type the first few letters of the share you are looking for) or you can link the Trades and quotes window to another window (see Linking Windows on page 11).
You have the option to view trades and quotes for previous days by selecting either Previous trading day, Choose date... or Next trading day from the context menu. Using Ctrl and the left (or right) arrow key on your keyboard will also change the day you are viewing. The Trades Summary dialog box can be accessed by double clicking in the window or from the context menu. It presents an up-to-the-minute breakdown of trade count, value, and volume for a share in terms of buys, sells and unknowns.
10. Messaging If you would like to keep in touch with other ShareScope Plus and Pro users, have a technical query or would like to send us your ShareScope wishlist requests, then the real time messaging facility is a convenient way for you to do this. To view the real time messaging facility available in ShareScope, simply select View : Real time messages…. The real time message inbox window will appear. Please note that you have to be connected to the intraday feed for messages to be sent or received.
After agreeing to the messaging policy, you will need to enter a Nick name in the top text box of the profile dialog box. This is how your name will be displayed in the Contacts list and when you send messages to other users. This is the only obligatory entry, so you can remain totally discreet. The rest of the information is optional and you may enter as much or as little as you choose. At the bottom of the dialog box are your Privacy options.
To send a message, select the name of the person you wish to send the message to. Type the title of the message in the Subject box and the message in the space provided. Click on the Post button in the bottom right-hand corner of the window. The message will be sent and it should reach the recipient within about five seconds, depending on the quality of the internet connection you are using. Reading Messages Incoming In the message inbox dialog box, you will see a list of all the messages you have received.
Page 42
11. Dynamic Data Exchange (DDE) A Dynamic Data Exchange (or DDE) link allows you to export intraday data into a spreadsheet (such as Microsoft Excel or Lotus 1-2-3) and watch the data update continuously. ShareScope aims to provide all the information that you need for trading in the program. However, should you wish to make your own calculations based on our data, you can do so by using a spreadsheet with the DDE function. This is designed to add extra flexibility to ShareScope Plus and Pro.
Examples If you want to see a fully working Dynamic Data Exchange spreadsheet, an example is provided with the program. It is called ShareScopeDDE.xls and the file can be found in the ShareScope Plus or ShareScope Pro folder on the hard drive of your computer, e.g. C:\Program Files\ShareScopePro. It is the spreadsheet shown on the previous page. Before opening the spreadsheet make sure that ShareScope Plus or Pro is open and connected to the intraday feed.
Here are some further examples of formulae to help get you started: FTSE 100, United Kingdom Indices, Current Mid Price =ShareScopeDDE|UKI_UKX!MID Vodafone Group plc, London Stock Exchange, Lowest Mid Price =ShareScopeDDE|LSE_VOD!MID_LOW Microsoft Corp, NASDAQ (normal market), Trade Price =ShareScopeDDE|NNM_MSFT!TRADE Hilton Hotels CP, New York Stock Exchange, Opening Price =ShareScopeDDE|NYSE_HLT!RTOPEN US Cellular, American Stock Exchange, Previous Close Price =ShareScopeDDE|AMEX_USM!CLOSE These examples
Page 46
Index A Alarms Adding global alarms, 33 Adjusting individual alarms, 31 Alarms on lines, 32 Intraday alarms, 31 News alarms, 32 Setting individual alarms, 31 Triggered alarms, 35 Viewing triggered alarms, 34 Analytics Intraday analytics, 18 C Columns Adding intraday columns, 24 Adding trades/quotes columns, 38 Fit width, 26 Sorting columns, 26 Context menus Intraday columns context menu, 24 Intraday graph context menu, 14 List window context menu, 22 Trades/quotes context menu, 37 D Data Delivery levels,
G Graphs Adding intraday analytics to graphs, 18 Graph design, 14 Intraday graph design, 14 Intraday graph window, 13 Lines on graphs, 19 Micrographs, 21, 25, 26 Shapes, 19 I Intraday Adding intraday columns, 24 Alarms, 31 Adding global alarms, 33 Adjusting individual alarms, 31 News alarms, 32 Setting alarms on lines, 32 Setting individual alarms, 31 Triggered alarms, 35 Viewing triggered alarms, 34 Analytics, 18 Connecting to the data feed, 8 Data, 5, 7 Add or share intraday data, 10 Graph window, 13 Ana
L Library Opening the library, 15 Saving and restoring settings, 15 List window Adding intraday columns, 24 Context menu, 22 Fit width, 26 List design, 22 List window, 21 Sorting columns, 26 M Messaging, 39 Closing messaging, Reading messages, Sending messages, Setting your profile, 41 41 40 39 N News AFX news, 9 Intraday news, 9 Intraday news alarms, 32 O OHLCV OHLCV data, 5 OHLCV terminology, 6 Q Quotes Adding trades/quotes columns, 38 Trades and/or quotes list, 37 Trades or quotes, 37 T Terminology
Ticker, 27 Closing the price ticker, 30 Ticker design, 28 Trade and/or quotes list, 37 Adding columns, 38 W Windows, 11 Adding and resizing windows, 12 Intraday graph window, 13 Linking windows, 11 List window, 21 Resizing windows, 12 Windows layout, 12 Page 50
Ionic Information Limited 140 Goswell Road, London, EC1V 7DY Phone 020 7549 1100 • Fax 020 7549 1101 Email info@sharescope.co.uk • Web www.sharescope.co.