
7315 Manual Italian User Manual


7.5.2 Peaks and Valleys Table
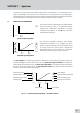
This function displays all the detected peaks and valleys
above the selected threshold, in tabular form. To open the
table press the key adjacent to the peaks and valleys
table icon. If the peaks and valleys threshold is switched
off this icon is not displayed.
In the peaks and valleys table screen it is possible to
display both peaks and valleys, just peaks or just valleys.
To display the peaks only press the key below the peak
only icon. To redisplay the peaks and valleys press the
same key again.
To display the valleys only press the key below the valley
only icon. To redisplay the peaks and valley press the
same key again.
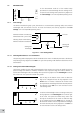
In the table the absorbance or % transmittance values
(depending on the operating mode selected in the scan
settings) are shown with the corresponding wavelength.
Use the keys adjacent to the arrow icons to scroll up
or down through the readings in the table. Press the
key adjacent to the tick icon to return to the expanded
operating menu.
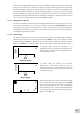
7.5.3 Spectral Points Analysis
The spectral points analysis function enables points to be selected from the scan to analyse the
absorbance or % transmittance at a selected wavelength. To access this function press the key adjacent
to the spectral points analysis icon and this opens the selection screen.
A solid vertical line will appear on the far right of the
screen. Use the keys below the greater than (>) or less
than (<) icons to move the line along the spectrum by
decreasing or increasing the wavelength by one scan
interval, the double greater than (>>) or less than (<<)
icons increase or decrease the wavelength by ten times
the scan interval.
As the vertical line moves along the scan the wavelength and absorbance or % transmittance value is
displayed at the top of the screen. To add the selected point from the spectrum to the spectral points
analysis table press the key adjacent to the add points to spectral points analysis table icon.
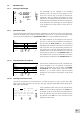
Only 6 points can be stored in the spectral points analysis
table. When adding a selected point to the table the
position this point is in the table will flash up on the
screen. If the table is full and a 7th point is selected to go
into the table a warning symbol will flash up and a point
must be deleted from the table before another point can
be added.
36
-- --
AB Snm
45 0 1. 000
1. 50 0
1. 50 0
AB Snm
42 5
47 5
-- --
-- --
2.500
1.000
-2.500
350 550450nm
1. 50 0
-- --
1. 50 0
AB Snm
42 5
45 0
47 5
-- --
1. 00 0
-- --
2.500
ABS
1.000
-0.500
350 550450nm