
User Guide


5
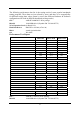
The following performance data list is the testing result of some popular benchmark
testing programs. These data are just referred by users, and there is no responsibility
for different testing data values gotten by users (the different Hardware & Software
configuration will result in different benchmark testing results.)
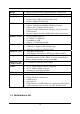
CPU:
AMD K7 900MHz FC-PGA package
DRAM:
128M SDRAM x2 (Hyundai GM 72V66841ET75)
VGA Expansion Card:
On Board VGA
Hard Disk Driver:
IBM DTLA-305040 (ATA-100)
BIOS:
Award Optimal default
OS:
Win 98SE
Performance Test Report
Share 8M Share 16M Share 32M
3D Mark 99
1712 1708 1711
3D Mark 2000
754 711 733
3D Winbench 99 V1.2
469 475 476
3D Winbench 2000
16.1 18.8 19.8
Final Reality
5.04 5.02 5.00
Winstone 99 V1.3
28.7 28.5 28.7
Content Creation Winstone 2000
34.6 32.5 33.9
Content Creation Winstone 2001
38.2 37.6 36.7
Business Winstone 2001
32.1 31.9 31.7
Winbench 99 :
CPU Mark 99
70.8 70.7 70.6
FPU Winmark 99
4810 4810 4800
Business Disk Winmark99
4570 4500 4630
Hi-end Disk Winmark99
16600 16500 17000
Business Graphic Winmark
208 227 227
Hi-end Graphic Winmark
675 886 884
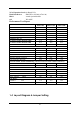
SYS Mark 2000 : SISMark 2000 Rating ( Internet Content Creation / Office Productivity )
Suites
152 (154/151) 153 (153/153) 153 (154/153)
Official
152 (155/149) 153 (153/153) 153 (155/152)
SISOFT Sandra 2000 :
CPU MIPS
2774 2773 2772
FPU MFLOPS
1186 1188 1188
CPU / Memory MB/S
252 252 252
FPU / Memory MB/S 297 297 297
QUAKE3 :
DEMO1 FPS
25.9 26.2 26.2
DEMO2 FPS
24.7 24.9 25.0
CPU:
AMD K7 1.2GHz FC-PGA package
DRAM:
128M SDRAM x2 (Hyundai GM 72V66841ET75)