
Datasheet


V2.00/EN/00710338/2019-11-07
Page 4/24Data Sheet 706521
-802*PE+&R.*
'HOLYHU\DGGUHVV 0DFNHQURGWVWUDH
)XOGD*HUPDQ\
3RVWDODGGUHVV
)XOGD*HUPDQ\
3KRQH
)D[
(PDLO PDLO#MXPRQHW
,QWHUQHW ZZZMXPRQHW
-802,QVWUXPHQW&R/WG
-802+RXVH
7HPSOH%DQN5LYHUZD\
+DUORZ(VVH[&0'<8.
3KRQH
)D[
(PDLO VDOHV#MXPRFRXN
,QWHUQHW ZZZMXPRFRXN
-8023URFHVV&RQWURO,QF
0\HUV5RDG
(DVW6\UDFXVH1<86$
3KRQH
)D[
(PDLO LQIRXV#MXPRQHW
,QWHUQHW ZZZMXPRXVDFRP
70652100T10Z001K000
put variables are real values. As an alternative
to entering a formula, the following mathemat-
ical functions are already available: difference,
ratio, humidity, and floating average.
The logic function allows various Boolean val-
ues to be linked using a logic formula (maxi-
mum of 600 ASCII characters). The output
variables are Boolean values.
The math and logic module can only be config-
ured via the setup program.
Structured text
The user has the option to create his/her own
application using the "Structured text" option
(extra code).
The application with the ST editor, which is
part of the setup program, is created in the
PLC programming language "Structured text".
The finished application is transmitted to the
device and continuously processed there.
There are online-debugger functions available
in the ST editor for testing and troubleshoot-
ing.
FDA-compliant data record-
ing
Extra code 888 allows the paperless recorder
to fully meet FDA requirements in accordance
with 21 CFR Part 11. User management and
startup require the PC software package (in-
cluding PCS and PCAT).
The device supports up to 50 users with spe-
cific rights. The user has the option to provide
a completed batch or the recording data of a
certain time range with their electronic signa-
ture. A logged-in user can also provide their
signature during logoff – it applies to the entire
time period for which the user was logged in.
Visualization on the device
Various display types are available to visualize
the measurement data on the paperless re-
corder. The visualization screen after power-
on-reset can be selected in the configuration,
as can the screen that appears when the
home button is pressed.
The colors of the individual channels and the
background color of the analog curves and the
digital traces can be set.
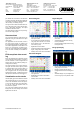
Vertical diagram
• Analog curves and digital traces running
from top to bottom
• Up to 6 analog and 6 digital channels in
one group can be shown on one screen
• Group rotation (max. 4, also with maxi-
mum memory cycle)
• Digital traces can be hidden
• Channel information (short description of
signal, analog value) can be hidden
• Auxiliary lines can be shown and hidden
Horizontal diagram
• Analog curves and digital traces running
from right to left
• Digital traces and channel information
can be hidden
• Auxiliary lines can be shown and hidden
Digital diagram
• Up to 6 digital channels in one group on
one screen
• Vertical display (digital traces running
from top to bottom)
• Horizontal display (digital traces running
from right to left)
Bar graph display
• Up to 6 analog channels in one group as
a bar graph on one screen
• Display of scaling and limit values
• Configurable bar color and background
color
• Additional display of up to 6 digital chan-
nels in one group as a symbol B1 to B6