
Software Owner manual


39
8 Evaluation - Graphics area
The guideline can also be shifted from the PC keyboard by using the key
combination Shift-Cursor left or Shift-Cursor right.
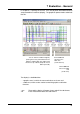
Properties !
Font size
Use this setting to alter the size of the scaling for the X- and Y-axes.
Properties !
Zoom
This setting can be used to influence the marking of a section that has to be
spread. You can choose between continuous marking (Any) or marking at a
fixed spacing (Division).
Properties !
Increase speed
The options “Do not display measurement info” and “Do not draw in
background” are not marked with a as a default setting, which means that
these functions are active.
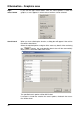
Do not display measurement info
If the mouse pointer is placed on a measured value within the graphics and
rested there, a window with the current amplitude and time values will appear.
The window will disappear after a few seconds. If you deactivate the function
( ), the evaluation program has a reduced computing load and will thus
become somewhat faster.
Do not draw in background
Standard procedure is that the picture is generated without being visible to the
user and then suddenly switched into display (drawn in the background). If you
select “Do not draw in background”, the graphics is displayed online on the
screen. This means that you can observe how the curve profile is drawn. This
view mode is somewhat faster than drawing in the background.
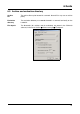
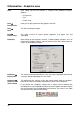
H
The guideline is positioned with regard to the “real measured
values”, i.e. it may diverge from the optical profile of the curve,
since more measured values exist than are displayed.
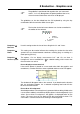
H
The function for the left mouse button can also be controlled via
the toolbar of the software.
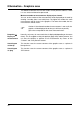
Zoom X-axis
Zoom Y-axis
Zoom X+Y-axes
Guideline