Airborne Particle Counter MODEL 3900 -Part11 EditionOperation Manual Please read this operation manual carefully and understand the warnings described within before operating this instrument. Keep this manual handy for future reference. 01001 10.
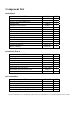
Component List ■ Standard ITEM Main Unit Power Cord (with NEMA plug) Standard Inlet Isokinetic Suction Probe Zero Filter Tygon Tube (2M) Printer Paper (Dust Free Paper) Measurement Software Operation Manual Test Certificate Fuse (0217002.MXP) CF Card – 256MB (preinstalled in the instrument) Lithium-ion Battery* Battery Charger* MODEL 3900 3900-06 3900-07 3900-04 3900-05 3900-08 BSA2-06 BSA2-10 QTY 1 1 1 1 1 1 2 1 1 1 2 1 1 1 * Lithium-ion battery and battery charger are not included in Model 3900-01.
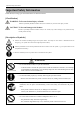
Important Safety Information i Laser Classification This instrument is classified as a Class 1 Laser Product in accordance with the following standards. ● EN60825-1: 2007 ● I EC60825-1: 2007 CLASS 1 LASER PRODUCT EN60825-1 : 2007 * Class 1 Laser: Lasers that are considered to be safe under reasonably foreseeable conditions of operation, including the use of optical instruments for intrabeam viewing.
Important Safety Information ii Important Safety Information In this manual, warning types and classifications are defined as follows. [Classification] WARNING: To Prevent Serious Injury or Death Indicates a potentially hazardous situation which, if not avoided, may result in serious injury or death. CAUTION: To Prevent Damage to the Product Indicates a potentially hazardous situation which, if not avoided, may result in damage to the product that may void the product warranty.
Important Safety Information iii WARNING ¤ Unplug the power cord when the instrument is not in use. …… Failure to observe the above may result in electric shock, fire or damage to internal circuitry. ¤ Install the instrument where you can pull the power cord out anytime. ¤ When using the power cord, ensure there is no dust on the power plug. The AC outlet used must be within the specified power requirement of 100 ~ 240V. …… Failure to observe the above may result in fire.
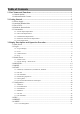
Table of Contents 1. Part Names and Functions ..................................................................................... 1 1.1 General Outline ...................................................................................................................1 1.2 Airborne Particle Counter....................................................................................................1 2. Getting Started ..........................................................................................
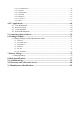
3.10.2 Log Maintenance ...................................................................................................................... 54 3.10.3 OPTION.................................................................................................................................... 55 3.10.4 HARDWARE ........................................................................................................................... 62 3.10.5 SYSTEM..............................................................
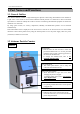
1. Part Names and Functions 1 1. Part Names and Functions 1.1 General Outline This Airborne Particle Counter is a light scattering laser particle counter using semiconductor laser radiation as a light source. This counter is used to detect ultrafine airborne particle in a cleanroom or other environment equivalent to a cleanroom. Mainly this counter is used as a monitoring measurement equipment to monitor the cleanliness in a cleanroom.
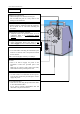
1. Part Names and Functions BACK/LEFT Sampling Air Exhaust Port --- Filtered sample air is exhausted at this port. Do not block the port as it may result in the damage to the instrument. Exhaust Outlet for Ventilating the Instrument ---Exhaust outlet for ventilating inside the instrument. Do not block the air vent when installing the instrument. Optional Sensor Connecting Terminal --- Terminals where the optional sensor is to be connected. Refer to 5. Connecting Option Sensors for details.
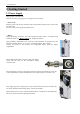
2. Getting Started 2. Getting Started 2.1 Power Supply Supply power to the main unit. There are two ways to supply power; using power cord or battery. -- Power Cord -Plug the power cord into the connecting port located under the main power switch on the rear of the unit. AC100V~240V power supply line shall be used. -- Battery -Charge the battery in advance. You cannot charge the battery when it is installed in the instrument. (Refer to 7. Battery Charge for charging the battery.
2. Getting Started 4 After pressing the POWER switch on the front of the instrument, you will hear a beep sound and the LED will light up. If the power is supplied by the AC line, the LED is green and if supplied by battery, the LED is red. Several seconds later, the initial screen appears automatically. Refer to 3. Display Description and Operation Procedure for the details about the operation screen. 2.2 Attaching Standard Inlet Upon measuring, attach the standard inlet following the procedure below.
2. Getting Started 2.3 Zero Check If the internal optical system is dirty, you may not be able to perform an accurate measurement. To confirm the cleanliness of the internal optical system, perform Zero Check before measuring. Attach the standard inlet to the instrument. Next, attach the zero filter to the standard inlet using the supplied Tygon tube. The length of the tube is not critical. However, make sure that the tube is not bent. (Approx.
2. Getting Started 6 2.5 Consumables 2.5.1 Printer Paper Replacement Preparing printer paper When the provided printer paper runs out, please purchase new printer paper (dust free paper), Model 3900-05. Installing printer paper 1. Press the Paper Cover Open Button to open the paper cover. 2. Place the paper as shown in the below picture. 3. Pull the head of paper slightly from the outside the printer. Make sure that slight portion of the paper head is out of the printer when closing the cover. 2.5.
2. Getting Started 7 2.5.5 Fuse Replacement Preparing fuse When the two fuses which have already been installed upon purchasing and the provided two other fuses are broken or lost, please purchase a new set of fuses (0217002.MXP) (a set of two fuses). Fuse Rating: AC250V / 2A Installing the fuse (1) Use a tip of a flat-blade screwdriver to take the fuse holder out. (2) Remove the fuse(s) to be replaced and install new fuse(s). (3) After the fuse is replaced, push the fuse holder in.
3. Display Description and Operation Procedure 8 3. Display Description and Operation Procedure 3.1 Boot Screen A few seconds after the instrument is turned ON, the screen shown on the left will be displayed. The system is initializing. Please wait for a few moments.
3. Display Description and Operation Procedure 9 3.2 Log-In 3.2.1 Log-In Display Type your user ID and password in the field and press [OK] button. Press [Shut Down] button to turn off the 3900. [CAPS] button: To type upper case letters [SWITCH] button: Jump to next field [CLR] button: Clear input [BS] button: Back space, delete the preceding character 3.2.2 User The 3900 manages the usage log based on user ID. Managing users from the user setting display (Refer 3.10.1 User Management).
3. Display Description and Operation Procedure 10 3.2.3 Authentication Logging in and certain activity require user authentication. User ID and password are required when user logs in the 3900. Only password is required for other activities. The maximum number of login trial is three times. After the third time of failed login, the account is revoked. 3.2.4 Log The 3900 saves the history of activities, error messages, and alarms in the log file.
3. Display Description and Operation Procedure 11 3.3 Initial Screen 3.3.1 Initial Screen (1) When the instrument is booted up, the initial screen on the left will be displayed. All operations can be started from this screen. (3) (5) (2) (6) (4) (1) Data Display: Displays numeric value and chart. (2) Measurement Condition: Displays measurement mode, measurement setting and measurement status. (3) Environment Data: Displays the current status when using option sensors.
3. Display Description and Operation Procedure 12 To switch to display chart. Indicates if the instrument is powered by AC power cord or battery. If battery-powered, the remaining battery level is also shown. / / Indicates the pump status and pump error. When the pump is operating properly, the icon is in blue. When the pump is off, the icon is in gray. Indicates LD status and LD error. When the LD is operating properly, the icon is in blue.
3. Display Description and Operation Procedure 13 3.3.
3. Display Description and Operation Procedure 14 3.4 MONITOR Tap [MONITOR] on the initial screen to start monitoring. Sampling will start in 10 seconds after the pump starts operating. * Note that if the pump is already operating, sampling will start immediately when you tap [MONITOR]. * Note that the instrument is capable of 180 hours of continuous operation. While measuring, tap [MONITOR] again. A dialog will be displayed asking you if you want to stop monitoring. Tap [Yes] to stop monitoring.
3. Display Description and Operation Procedure 15 3.5 MODE Tap [MODE] to display the mode selection window (Authentication required). *User needs to have authorization to change measurement mode. Choose a mode from the below selection and tap it; “SINGLE”, “CONTINUOUS”, “INTERVAL”, “REPEAT”, “STATS” or “STANDARD”. Note that the instrument is capable of 180 hours of continuous operation in every measurement mode. Mode Description [SINGLE MODE] Perform a measurement once within the pre-set time frame.
3. Display Description and Operation Procedure 16 Below is a breakdown of the Wait Time.
3. Display Description and Operation Procedure 17 [CONTINUOUS MODE] Start/Stop measuring manually. Example: If the setting is as follows in “CONFIG” menu (Refer to 3.7.2 CONTINU): INTERVAL : N/A SAMPLE T. : N/A CYCLES : N/A A continuous measurement is performed until you manually stop. Measurement Flow Wait Time Sampling Time Start Measurement STOP Finish Measurement [INTERVAL MODE] Configure INTERVAL, SAMPLE T and CYCLES, and repeat measuring.
3. Display Description and Operation Procedure 18 [REPEAT MODE] Configure SAMPLE T and CYCLES, and repeat measuring. Example: If the setting is as follows in “CONFIG” menu (Refer to 3.7.4 REPEAT): INTERVAL : N/A SAMPLE T. : 00:00:15 CYCLES : 20 20 measurement cycles lasting 15 seconds each are taken.
3. Display Description and Operation Procedure 19 3.6 START 3.6.1 SINGLE, CONTINUOUS, INTERVAL, REPEAT Tap [START] on the main screen to start a measurement in the setting configured in 3.5 MODE and 3.7 CONFIG. z If “START DELAY” is NOT checked in “CONFIG” setting: Upon tapping [START], the pump will begin running. After the pump has run for 10 seconds to stabilize, the measurement will begin z If only “START DELAY” is checked in “CONFIG” setting: Upon tapping [START], the Delay Time configured begins.
3. Display Description and Operation Procedure 20 Display screen example while measuring To display the chart tap button while measuring. Tap [STOP] to stop a measurement. * After a measurement in REPEAT mode or INTERVAL mode is finished, the measurement result will be displayed.
3. Display Description and Operation Procedure 21 After a measurement in INTERVAL and REPEAT mode, the measurement result will be displayed as shown in the previous page. If you want to view the measurement result again after closing the measurement result window, tap button to redisplay the measurement result.
3. Display Description and Operation Procedure 22 3.6.2 STATS - When not using MAP (Refer to 3.7 CONFIG for using a MAP.) Tap [START] to display “CONFIRM” window. A measurement will start based on the setting configured in 3.5 MODE and 3.7 CONFIG. Tap [START] to start a measurement. z If “START DELAY” is NOT checked in “CONFIG” setting: Upon tapping [START], the pump will begin running.
3. Display Description and Operation Procedure 23 Tap [STOP] to stop a measurement. Tap button while measuring to display a chart. When a measurement at each measurement point is finished, a measurement result window will be displayed each time. Tap [NEXT] to display “CONFIRM” window informing you the next measurement point, and wait for the next measurement. Tap [REMEASURE] to perform a re-measurement. Tap [PRINT] to print a measurement result.
3. Display Description and Operation Procedure 24 - When using MAP (Refer to 3.7 CONFIG for using a MAP.) In STATS mode, MAP will be displayed upon tapping [START]. A measurement will start based on the setting configured in 3.5 MODE and 3.7 CONFIG. Select a measurement point and tap [START] to start a measurement. Tap [STOP] to stop a measurement. Tap [ZOOM] to enlarge a MAP. (This button will become [NORMAL] button. Press [NORMAL] to display an entire MAP when a map is enlarged.
3. Display Description and Operation Procedure 25 Tap [START] on the MAP to start a measurement z If “START DELAY” is NOT checked in “CONFIG” setting: Upon tapping [START], the pump will begin running. After the pump has run for 10 seconds to stabilize, the measurement will begin. z If only “START DELAY” is checked in “CONFIG” setting: Upon tapping [START], the Delay Time configured begins.
3. Display Description and Operation Procedure 26 When a measurement is finished, a measurement result window will be displayed. Tap [NEXT] to display MAP again. Then the instrument waits for the next measurement point to be selected. Tap [REMEASURE] to perform a re-measurement. Tap [PRINT] to print a measurement result. When all measurements are finished, measurement result will be displayed. the You can view the result of a certain LOCATION POINT by selecting Location.
3. Display Description and Operation Procedure 27 3.6.3 STANDARD - When not using MAP (Refer to 3.7 CONFIG for using a MAP.) Tap [START] to display “CONFIRM” window. A measurement will start based on the setting configured in 3.5 MODE and 3.7 CONFIG. Tap [START] to start a measurement. z If “START DELAY” is NOT checked in “CONFIG” setting: Upon tapping [START], the pump will begin running.
3. Display Description and Operation Procedure 28 After a measurement at each location is finished, a measurement result will be displayed. In [RAW DATA] tab, measurement data will be displayed. In [CALC DATA] tab, calculated data of minimum (MIN), maximum (MAX) and average (AVE) will be displayed. Tap [NEXT] to display a “CONFIRM” window informing you of the next measurement point, and wait for the next measurement. Tap [REMEASURE] to perform a re-measurement. Tap [STOP] to stop a measurement.
3. Display Description and Operation Procedure 29 When all measurements are finished, the measurement result will be displayed. You can view the result of a certain LOCATION POINT by selecting Location. Tap [EVAL] to display CLEAN ROOM EVALUATION window. Tap [REMEASURE] to perform a re-measurement. Tap [PRINT] to print a measurement result. Tap [PRINT] to print a measurement result. By selecting particle size you can change the particle size of the data to be evaluated.
3. Display Description and Operation Procedure 30 - When using MAP (Refer to 3.7 CONFIG for using a MAP.) In STANDARD measurement tap [START] to display MAP. A measurement will start based on the setting configured in 3.5 MODE and 3.7 CONFIG. Select a measurement point and tap [START]. Tap [STOP] to stop a measurement. Tap [ZOOM] to enlarge a MAP. (This button will become [NORMAL] button. Press [NORMAL] to display an entire MAP when a map is enlarged.
3. Display Description and Operation Procedure 31 Select a measurement point and tap [DETAIL] to view the details of the selected measurement point. Tap [START] to start a measurement. z If “START DELAY” is NOT checked in “CONFIG” setting: Upon tapping [START], the pump will begin running. After the pump has run for 10 seconds to stabilize, the measurement will begin. z If only “START DELAY” is checked in “CONFIG” setting: Upon tapping [START], the Delay Time configured begins.
3. Display Description and Operation Procedure 32 After a measurement at each location is finished, a measurement result will be displayed. In [RAW DATA] tab, measurement data will be displayed. In [CALC DATA] tab, calculated data of minimum (MIN), maximum (MAX) and average (AVE) will be displayed. Tap [NEXT] to display MAP again and wait for the next point to be selected. Tap [REMEASURE] to perform a re-measurement. Tap [STOP] to stop a measurement. Tap [PRINT] to print a measurement result.
3. Display Description and Operation Procedure 33 After a whole set of measurement is complete, button will be displayed. If you want to view the measurement result again, tap button to redisplay the measurement result.
3. Display Description and Operation Procedure 3.6.4 Interlocking Operations On the screen displaying data for 6 particle sizes while sampling, tap a particle size on the screen to display the data of the particular particle size. Then to display data for 6 particle sizes back again, tap the particle size on the screen. On the screen with data of each particle size, tap to switch to display a chart while measuring.
3. Display Description and Operation Procedure 35 Time series chart will be displayed in REPEAT, INTERVAL, STATS and STANDARD mode. Tap on the display with data for 6 particle size to switch to Single display. Tap when Single display is set, the display will go back to Total display. For details on Total display and Single display, please refer to page 10. When chart is displayed, will be displayed after a measurement is complete.
3. Display Description and Operation Procedure 36 STATUS in Measurement RESULT There are six indications for STATUS; “OK”, “F”, “L”, “O”, “V” and “B”. Each means; OK: No error F: FLOW error L: LD error O: OPTION SENSOR error V: OVER B: BATTERY error Message when printing While data is being printed, the message shown on the left will be displayed. If you tap [STOP], you can cancel the printing. However, the data already transmitted to the printer will be printed.
3. Display Description and Operation Procedure 37 3.6.5 Saving Data If AUTO SAVE is not checked on the CONFIG setting window, data will not be saved in the file after measuring. If you try to change MODE or start another measurement when AUTO SAVE is not checked, you will get the message shown below. - Tap [YES] to save data. - Tap [NO] to discard data. If the electricity goes out during a measurement, data will be treated as below.
3. Display Description and Operation Procedure 38 3.6.6 In Case that Measurement is Interrupted If you stop a measurement in STATS or STANDARD mode before all measurements complete but there are more than one location where a measurement is finished, the instrument will be in a temporary state of suspension. The instrument will remain in a temporary state of suspension until a measurement restarts or completes. During this period you cannot change a measurement mode or CONFIG setting.
3. Display Description and Operation Procedure 39 [STANDARD] If you start a measurement when the instrument is in a temporary state of suspension, the message below will be displayed. Tap [YES] to resume measuring from the next LOCATION. Tap [NO] to display CLEAN ROOM EVALUATION. Then the measurement will be completed. Tap [PRINT] to print out the result. Tap [CANCEL] to close the EVALUATION window. CLEAN ROOM If you try to switch mode, the below message will be displayed. Tap [OK].
3. Display Description and Operation Procedure 40 3.7 Configuration In CONFIG setting screen you can configure measurement settings in each mode. You can set items such as INTERVAL, SAMPLE T., CYCLES, MANUAL STOP, AUTO SAVE, AUTO PRINT and START DELAY. Please note that the setting items vary depending on the measurement mode. *User needs to have authorization to change configuration settings. *User needs to have authorization to save user “PRESET” setting. 3.7.1 SINGLE You can set SAMPLE T.
3. Display Description and Operation Procedure 41 3.7.2 CONTINUOUS Check “AUTO SAVE” to store data automatically. Check “AUTO PRINT” to print data automatically. Check “START DELAY” to use delay time prior to a measurement. Check “Set time” to set the time when you want to start a measurement. Tap [OK] to save and activate the current settings (Authentication required). Tap [PRESET] to display a window asking you to input “PRESET NAME”. Tap the entry field to display the keyboard.
3. Display Description and Operation Procedure 42 3.7.3 INTERVAL You can set INTERVAL, SAMPLE T., CYCLES and MANUAL STOP. To set INTERVAL and SAMPLE T, tap the entry field to display a numeric keypad. Enter “hour”, “minute” and “second”, and tap [OK]. Tap entry field for CYCLES to display a numeric keypad. Tap the value you want to enter and tap [Enter]. Check “MANUAL STOP” to continue measuring until you stop measuring regardless of the CYCLES setting. Check “AUTO SAVE” to store data automatically.
3. Display Description and Operation Procedure 43 3.7.4 REPEAT You can set SAMPLE T., CYCLES and MANUAL STOP. Tap the entry field of SAMPLE T. to display a numeric keypad. Enter “hour”, “minute” and “second” and tap [OK]. Tap the entry field of “CYCLES” to display a numeric keypad. Enter a value and tap [Enter]. Check “MANUAL STOP” to continue measuring until you stop the measurement, regardless of the CYCLES setting. Check “AUTO SAVE” to store data automatically.
3. Display Description and Operation Procedure 44 3.7.5 STATS If there are any MAP files saved, select the FILE to load it in SCHEDULE. Tap the entry field for “SAMPLE T”. to display a numeric keypad. Enter “hour”, “minute” and “second” on the numeric keypad and tap [OK]. Tap the entry field of “CYCLES” to display a numeric keypad. Enter a value and tap [ENTER]. Check “AUTO SAVE” to store data automatically. Check “AUTO PRINT” to print data automatically.
3. Display Description and Operation Procedure 45 When a MAP file is specified in “SCHEDULE” on “MEASURE SETTING” screen, tap [MAP] to display a MAP. You can change the location order. Tap the Location to be changed. Use and buttons to change the order. Tap [OK]. Then a window will be displayed asking if you want to save the new order of the Location. Tap [YES] or [NO] (Authentication required). Tap [YES] to set the changes and go back to “CONFIG” setting screen. Tap [NO] to go back to MAP screen.
3. Display Description and Operation Procedure 46 3.7.6 STANDARD STANDARD Measurement Setting Depending on the STANDARD setting configured in 3.10.3 OPTION, the setting items for CLASS and items in EXTENSION tab varies. In the BASIC tab; Configure the setting of CLASS, SCHEDULE, ROOM, LOCATION, CYCLES and SAMPLE T. CLASS: Set the cleanliness level of the cleanroom to be measured. After configuring this setting, the appropriate particle size for the configured CLASS can be selected.
3. Display Description and Operation Procedure 47 Tap [PRESET] to display a window asking you to input PRESET NAME. Tap the entry field to display the keyboard. Enter the file name and tap [Enter]. Tap [OK] to save the current settings on the CF card. You can configure the saved measurement settings by loading a saved PRESET (Authentication required). Refer to 3.9 PRESET. Tap [MAP] button to display MAP. You can change the location order. Tap the Location to be changed.
3. Display Description and Operation Procedure 48 3.8 FILE Select [FILE] on the initial screen. Then a screen shown on the left will be displayed. You can display, print and delete data here. You can also display the list of files that has been output in the ALARM/ERROR LOG screen. *User needs to have authorization to copy file. *User needs to have authorization to delete file. The file name consists of abbreviation of the measurement mode + Date + Time.
3. Display Description and Operation Procedure 49 (a) Choose [COPY] button to copy file, and then user can select files. Insert CF card and save the selected file on the card. (b) Select files based on “MEASURE MODE” (c) Choose the file(s) to copy and tap [OK] to save (Authentication required). Copied files are encrypted, and can be deciphered with data processing software. (a) To delete files, check “DELETE”.
3. Display Description and Operation Procedure 50 3.9 PRESET Select “PRESET” on the initial screen to display CALL PRESET screen. The selected PRESET file will be reflected in the MODE and CONFIG setting. *User needs to have authorization to call “PRESET” files. *User needs to have authorization to delete “PRESET” files. The first two letters of the file name indicates the mode type.
3. Display Description and Operation Procedure 51 3.10 MENU Select “MENU” on the initial screen to display the CONTROL PANEL window. *User needs to have authorization to change the settings on the control panel. 3.10.1 User Management “User Setting” window shows up by choosing “USER ADMIN” menu on the control panel.
3. Display Description and Operation Procedure 52 User Information Window (a) (b) (c) (d) (e) (f) (g) (h) User Information Window for adding users and editing user information. “Information” tab for user information “Qualification” tab for setting authority level for user.
3. Display Description and Operation Procedure ¾ 53 Qualification Administrator: Administrator automatically has all authority level. “Manage Users” is only assigned to administrator. Manage User: enable to add, edit, delete, and activate / inactivate users. Access Control Panel: enable to change setting in the control panel. Change Measurement Setting: enable to change measurement settings. Change Measurement Mode: enable to change measurement mode. Use Preset: enable to create user preset file.
3. Display Description and Operation Procedure 54 3.10.2 Log Maintenance Log Maintenance window shows up when you choose “LOGS” on the control panel. User can review and print-out the log files, such as operation log, alarm log, and error log (a) *Authentication is required for “View Logs”. *Authentication is required for “Copy Files”. (b) (c) (d) (a) Log List Shows following information; Date/Time, User ID, Operation, Parameters, Result (b) User ID Select user ID to review its logs.
3. Display Description and Operation Procedure 55 3.10.3 OPTION In the OPTION window you can configure the following settings; - CHART - ALARM - STANDARD - MESSAGE - PRINT - START DELAY - · CHART SETTING Y-axis in LINEAR scale Y-axis in LOG scale X-axis Configure the axis of the chart and range settings. For X Axis select either “10”, “20”, “50”, “100”, “150” or “300”. For Y Axis in PARTICLE tab select either “LOG” or “LINEAR”. Select which MAX value to be set among four options.
3. Display Description and Operation Procedure 56 In OPTION tab, configure “MIN” and “MAX” settings for each sensor. For each sensor you can set three different values. Tap [APPLY] to save the setting value that is currently displayed in the tab (Authentication required). Tap [OK] to save the setting value and close the window (Authentication required). Tap [CANCEL] to discard the configure settings, and the previous settings will be applied.
3. Display Description and Operation Procedure 57 · ALARM SETTING In ALARM SETTING set threshold for particle alarm and option sensor alarm. In the PARTICLE tab, configure the unit and threshold for each particle. Check the particle size that you want to alarm by external contact output and audible alarm*. (* Note that audible alarm will be activated only when “Alarm Sound” is checked.) Also enter the threshold that you want to alarm. To enter the threshold tap entry field to display a numeric keypad.
3. Display Description and Operation Procedure 58 · SELECT STANDARD In the SELECT STANDARD window, select a measurement standard to be applied in the STANDARD mode. There are 7 types of standard as follows: ・ISO14644-1 ・ISO14644-1 SEQUENTIAL SAMPLING ・FEDERAL STANDARD (m) ・FEDERAL STANDARD (ft) ・BRITISH STANDARD ・EC GMP ・GB/T 16292-1996 * Refer to 3.5 MODE for the measurement standard. Select one standard and tap [OK] to activate the setting. Change the settings and tap [OK] (Authentication required).
3. Display Description and Operation Procedure 59 · MESSAGE SETTING In the MESSAGE SETTING window, you can choose to display or not to display a message of “PREPARATION”, and “DELAY”. Tap [OK] to activate the settings (Authentication required). Each message is; - PREPARATION: To be displayed after the pump is ON before sampling starts. - DELAY: To be displayed before sampling starts when START DELAY function is ON.
3. Display Description and Operation Procedure 60 · PRINT SETTING In the PRINT SETTING window set output items for printing. In RAW DATA tab, configure the following settings: - RAW data printing ON/OFF - Particle size to be printed - Option sensor data printing ON/OFF Check “RAW DATA INCLUDE” to print RAW data. Check the particle size of the data that you want to print. Check “OPTION” to output data of the option sensor.
3. Display Description and Operation Procedure 61 In CHART tab you can select the particle size that you want to print out in the hardcopy. If you tap [PRINT SCR] when time series chart is displayed, the chart of the selected particle size will be output one by one. If you check “ALL”, the chart which integrates each count of the all six particle sizes will be output. When particle base histogram is displayed, this setting is not available.
3. Display Description and Operation Procedure 62 3.10.4 HARDWARE In HARDWARE setting, you can configure the following settings; - OPTION SENSOR - PUMP - REMOTE MODE · OPTION SENSOR SETTING In the OPTION SENSOR SETTING window you can confirm if the option sensor is connected or not, and set to use or not to use the sensor. You can also set the unit and MIN/MAX range value for each sensor. MIN/MAX value should be the spec range for each sensor.
3. Display Description and Operation Procedure 63 · PUMP SETTING In the PUMP setting, set to turn the pump ON all the time or not. To turn the pump ON all the time, check the check box for “PUMP ALWAYS ON”. After [OK] button is tapped, defined value is saved to close window. When [CANCEL] button is tapped, defined value is canceled. If you set to turn the pump ON always, you can eliminate the PREPARATION time before sampling.
3. Display Description and Operation Procedure 64 3.10.5 SYSTEM In the SYSTEM setting, configure the following settings: - DATE/TIME - LCD - SOUND - COMMUNICATION - LOCALE - ABOUT (System Information) · DATE/TIME DATE/TIME setting; To adjust DATE, tap [▼] to display a calendar and set the date. To change the TIME, tap “hour”, “minute” and “second” using [▲/▼] buttons. Tap [OK] to activate the settings (Authentication required).
3. Display Description and Operation Procedure 65 · SOUND In SOUND setting, you can configure the sound volume and sound type. You can use Windows standard WAV format file for the sound function. Create a folder called Sound on the CF card. Then copy the WAV file in the folder. You will be able to select the file from the list. * is added to all of the WAV file names on the CF card. Default Sound: Set the sound for erroneous operation. When this item is unchecked, this sound function will be off.
3. Display Description and Operation Procedure 66 · LOCALE In LOCALE SETTING you can set the date display format, bound symbol when saving file and the time zone. Tap [OK] to save the settings and close the window. Tap [CANCEL] to discard the configured setting. *When transferring data and other files to a PC, different date/time or timestamp will be displayed if the setting of time zone is different from the one in the PC.
3. Display Description and Operation Procedure 67 3.10.7 LOG OUT [LOG OUT] button is tapped, “LOG IN” screen shows up. At this screen, users and shut-down can be done. [OK] button is tapped after user ID and password are input, you return to MENU screen. Tap [SHUTDOWN]. A window will be displayed asking “Do you want to shut down the power?” In 5 seconds after tapping [YES], the instrument will shut down. *Make sure to turn power off at “LOG IN” screen.
4. PC Applications 68 4. PC Applications The provided PC applications allow you to process measurement data and to operate the instrument on a Windows computer via network. This section describes important settings when using PC applications. For details of each application, refer to the operation manual “AIRBORNE PARTICLE COUNTER SOFTWARE”. 4.1 User Management You can transfer files from the instrument and edit them on PCs.
4. PC Applications 69 4.4 Remote Measurement You can read data directly from PCs connected via network to take measurements. ・ You need to connect the instrument to the network and make appropriate settings in the COMMUNICATION SETTING. ・Before taking remote measurements, the REMOTE MODE window will be displayed from the CONTROL PANEL window of the instrument. ・Enter the HOST NAME specified in the COMMUNICATION SETTING for the destination.
5. Connecting Option Sensors 70 5. Connecting Option Sensors Three types of sensors are available as optional extras for this instrument. By connecting sensors to four different connectors on the rear of the unit, you can perform three different kinds of measurement and one contact output simultaneously. Temperature and Humidity Probe - Model 0844 Temp. Range 0 ~ 50 °C (32~122 °F) ±0.5 °C (at the air velocity of 0.2m/s Temp.
6. Printing Example 6. Printing Example 6.1 Printing Example for Each Measurement Mode 6.1.1 SINGLE [SG20101201120000] Ser.No. = 654321 Measured by kanomax Measured on 12/01/2010 Sample Time = 00:01:00 Repeats = 1 Printed by kanomax Particle [p][Total] TIME 0.3um 0.5um 1.0um 12:00:00 8000 5000 3000 TIME 3.0um 5.0um 10.0um 12:00:00 1000 500 100 TIME T[C] H[%] V[m/s] P[Pa] 12:00:00 25.2 68.5 0.1 15 6.1.2 CONTINUOUS [CO20101201120000] Ser.No.
6. Printing Example 72 6.1.3 INTERVAL [IN20101201120000] Ser. No. = 654321 Measured by kanomax Measured on 12/01/2010 Sample Time = 00:00:06 Repeats = 10 Printed by kanomax Start at 12/01/2010 12:00:00 Sample Time = 00:00:06 Repeats = 10 Particles [p] 0.3um Min= 15623 Ave= 15848.3 0.5um Min= 389 Ave= 441.9 1.0um Min= 57 Ave= 90.9 3.0um Min= 3 Ave= 7.4 5.0um Min= 0 Ave= 1.4 10.0um Min= 0 Ave= 0.2 Temperature [C] Min= 24.8 Ave= 25.2 Humidity [%] Min= 64.3 Ave= 65.4 Velocity [m/s] Min= 0.1 Ave= 0.
6. Printing Example 73 6.1.4 REPEAT “*” is indicated when the alarm was activated. This applies to all the other measurement modes. [RP200101201120000] Ser. No. = 654321 Measured by kanomax Measured on 12/01/2010 Sample Time = 00:01:00 Repeats = 5 Printed by kanomax Start at 12/01/2010 12:00:00 Sample Time = 00:00:06 Repeats = 5 Particles [p] 0.3um Min= 15623 Ave= 15793.0 0.5um Min= 389 Ave= 453.0 1.0um Min= 84 Ave= 95.4 3.0um Min= 3 Ave= 6.2 5.0um Min= 0 Ave= 1.4 10.0um Min= 0 Ave= 0.
6. Printing Example 74 6.1.5 STATS [ST20101201120000] Ser. No. = 654321 Measured by kanomax Measured on 12/01/2010 Sample Time = 00:01:00 Repeats = 5 Printed by kanomax 1:Location1 (1/5) Start at 12/01/2010 12:00:00 Sample Time = 00:00:06 Repeats = 10 Particles [p] 0.3um Min= 15623 Ave= 15848.3 0.5um Min= 389 Ave= 441.9 1.0um Min= 57 Ave= 90.9 3.0um Min= 3 Ave= 7.4 5.0um Min= 0 Ave= 1.4 10.0um Min= 0 Ave= 0.2 Temperature [C] Min= 24.8 Ave= 25.2 Humidity [%] Min= 64.3 Ave= 65.4 Velocity [m/s] Min= 0.
6. Printing Example 75 6.1.6 STANDARD [IS20101201120000] Ser. No. = 654321 Measured by kanomax Measured on 12/01/2010 Sample Time = 00:01:00 Repeats = 5 Printed by kanomax Class = ISO 6 Sizes = 0.3um 1:Location1 2:Location2 3:Location3 4:Location4 5:Location5 ALL SE UCL 2887279 2848409 2793992 2904593 2840989 p/m3 p/m3 p/m3 p/m3 p/m3 Particles [p][Total] TIME 0.3um 0.5um 12:00:00 15924 389 12:01:00 15623 439 NG NG NG NG NG Eval. data : 2855053 p/m3 : 19317.
7. Battery Charge 76 7. Battery Charge 7.1 Charging Battery You cannot charge the battery when it is installed in the instrument. Open the battery compartment cover on the rear of the instrument. To open the cover turn the knob around 90 degrees. (Use a coin or something similar to turn it easily.) To disconnect the cable from the battery, hold the sides of the cable connector as shown in the picture below and remove the battery. Connect the battery to the provided charger to recharge the battery.
8. Main Specifications 77 8. Main Specifications Product Name Airborne Particle Counter Model Model 3900 Optical Source Particle Size Distribution Rated Flow Counting Efficiency Spurious Count Max Detectable Concentration Sampling Time Interval Time Delay Time Repeat Times Location Number Alarm Setting Laser Diode (two-year warranty) 0.3 / 0.5 / 1.0 / 3.0 / 5.0 / 10.0 μm (6 Channels) 28.3L/min. 50±20% (Compliant with ISO 21501-4) 0.
9. Troubleshooting 78 9. Troubleshooting Symptom Possible Cause Maintenance Cannot obtain Zero Count 1) Inside the optical system may be Attach the zero filter and perform aging for a (When using a filter) dirty. prolonged time. After performing a measurement in the highly concentrated environment, attach the zero filter and perform aging. 2) The filter’s air tightness may be Replace your zero filter. deteriorated.
9. Troubleshooting Symptom 79 Possible Cause Maintenance 【LD ERR】 The laser may be damaged. Return the instrument to your distributor or to your KANOMAX service center for repair. 【FLOW ERR】 The flow channel may be interrupted. Make sure that the inlet and outlet are not blocked. The pump may be damaged. Return the instrument to your distributor or to your KANOMAX service center for repair. 【BATTERY ERR】 Power capacity is low. If using a rechargeable battery, charge the battery.
10. Warranty and After-sales Service 80 10. Warranty and After-sales Service KANOMAX Limited Warranty The limited warranty set below is given by KANOMAX with respect to the KANOMAX brand Airborne Particle Counter, its attachment parts including Probe and other accessories (hereafter referred to as “PRODUCT”) that you have purchased. PRODUCT you have purchased shall be the only one that the limited warranty stated herein applies to.
10. Warranty and After-sales Service 81 After-sales Service If the PRODUCT is malfunctioning, please check with “Troubleshooting” to find possible cause first. Repair parts are retained for a minimum period of five (5) years after production cessation of the PRODUCT. This storage period of repair parts is considered as the period during which KANOMAX can provide repair service. For more information, please contact your sales representative.
11. Manufacturer Identification 82 11. Manufacturer Identification The country of the manufacture for this instrument is identified as shown below. (1) For the products made in Japan, “CALIBRATED IN JAPAN” is indicated on the product identification label. Manufacturer: KANOMAX JAPAN INC.
USA & Europe KANOMAX USA, INC. PO Box 372, 219 US Hwy. 206, Andover, NJ 07821 U.S.A. TEL: 1-800-247-8887 / 1-973-786-6386 FAX: 1-973-786-7586 URL: http://www.kanomax-usa.com/ E-Mail: info@kanomax-usa.com Japan & Asia KANOMAX JAPAN INC. 2-1 Shimizu Suita City, Osaka 565-0805, Japan TEL: 81-6-6877-0183 FAX: 81-6-6877-5570 URL: http://www.kanomax.co.jp/ E-Mail: sales@kanomax.co.jp China Shenyang Kano Scientific Instrument Co., Ltd No.