
Manual

3. Display Description and Operation Procedure
56
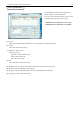
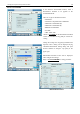
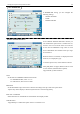
In OPTION tab, configure “MIN” and “MAX”
settings for each sensor.
For each sensor you can set three different values.
Tap [APPLY] to save the setting value that is
currently displayed in the tab (Authentication
required).
Tap [OK] to save the setting value and close the
window (Authentication required).
Tap [CANCEL] to discard the configure settings,
and the previous settings will be applied.
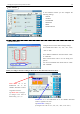
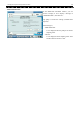
In the chart, you can change the MIN and MAX
values of the Y axis based on the three different
settings configured in this tab.
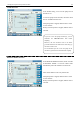
When you configure the chart setting as shown above, the chat will be shown as below.
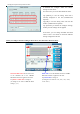
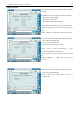
MAX value set in the OPTION tab in the CHART
SETTING window is applied in the chart.
Tap MAX value to change it.
(It changes in the order of “10”, “20”, “50”, “100”,
“150” “300”.)
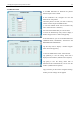
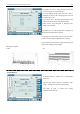
MAX and MIN values set for each sensor
in the OPTION tab in the CHART
SETTING window is applied in the chart.
Tap MAX or MIN value to change it.
(It changes in the order of MIN & MAX
setting 1, 2, 3.)