
Software Manual User guide

29
6. Measuring Software
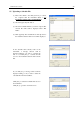
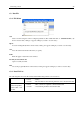
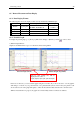
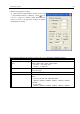
2) Particle Graph Parameter Settings
To edit the Particle Graph Parameter Settings, click [View]
-> [Graph Parameter Edit] -> [Particle], or click on the
tool bar to display the “Particle Graph Parameter Edit”
dialog box shown on the right. Then configure the Particle
Graph Parameter Settings.
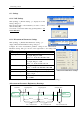
The following table lists the settings you may choose for the Particle Graph Parameters:
Setting Item Settings
Horizontal axis (time axis) range
setting
Select a range from below:
10min, 20min, 30min, 40min, 50min, 60min
1~24 hours – on an hourly basis
1~30 days – on daily basis
Displayed items on Vertical axis Up to 6 different particle size (0.3, 0.5, 1, 3, 5, 10 µm) can be displayed
on the same graph.
Types of vertical axis Select Linear or Logarithm
Vertical axis display range Select a range from below;
Linear:
10, 20, 50, 100, 200, 500, 1000, 2000, 5000,
1.00E+04, 1.00E+05, 1.00E+06, 1.00E+07, 1.00E+08, 1.00E+09
Logarithm:
10, 100, 1000,
1.00E+04, 1.00E+05, 1.00E+06, 1.00E+07, 1.00E+08, 1.00E+09