
Software Manual User guide


30
6. Measuring Software
6.6.3. Temperature, Humidity, Air Velocity and Differential Pressure Graph
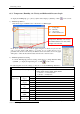
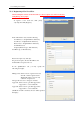
To display the TVHP graph, go to [View] -> [Time Series Graph] -> [Particle] or click on the tool bar.
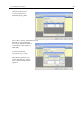
1) THVP Graph Window
Only a linear type is available for the vertical axis for a THVP graph.
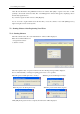
In the above window, you can scroll the graph using the scroll bars. If you move the
cursor over the graph it will change to a red bar. As you position the bar over a
particular time (shown on the X axis), the THVP count shown at the bottom of the graph
will update to reflect the measurement data under the bar’s current location.
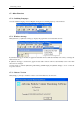
2) THVP Graph Parameter Setting
To edit the THVP graph parameter settings, click [View] -> [Graph Parameter Edit]
-> [THVP…] to display the right dialog box, or click on the tool bar.
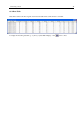
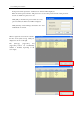
The following table shows the settings you may choose for the TVHP Graph Parameters:
Setting Item Settings
Horizontal axis (time axis) range setting Select a range from below:
10min, 20min, 30min, 40min, 50min, 60min
1~24 hours – on an hourly basis
1~30 days – on daily basis
Max Select: 5, 10, 15, 20, 25, 30, 35, 40, 45, 50 Temperature
(deg C)
Min Select: 0, 5, 10, 15, 20, 25, 30, 35, 40, 45
Max Select: 40, 50, 60, 70, 80, 90, 100, 110, 120, 130 Temperature
(deg F)
Min Select: 30, 40, 50, 60, 70, 80, 90, 100, 110, 120
Max Select: 10, 20, 30, 40, 50, 60, 70, 80, 90, 100 Humidity
(%)
Min Select: 0, 10, 20, 30, 40, 50, 60, 70, 80, 90
Max Select: 0.1, 0.2, 0.3, 0.4, 0.5, 0.6, 0.7, 0.8, 0.9, 1.0 Air Velocity
(m/s)
Min Select: 0.0, 0.1, 0.2, 0.3, 0.4, 0.5, 0.6, 0.7, 0.8, 0.9
Max Select: 0.1, 0.2, 0.3, 0.4, 0.5, 0.6, 0.7, 0.8, 0.9, 1.0 Air Velocity
(FPM)
Min Select: 0.0, 0.1, 0.2, 0.3, 0.4, 0.5, 0.6, 0.7, 0.8, 0.9
Max Select: 200, 150, 100, 50, 0, -50, -100, -150, -200
Vertical axis
display range
Differential
Pressure (Pa)
Min Select: 200, 150, 100, 50, 0, -50, -100, -150, -200
*Refer to 6.4.2 Measurement Parameter Settings if you want to change the unit of temperature or air velocity
used for measuring.
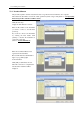
Temperature, Humidity, Air Velocity,
and Differential Pressure data will be
dis
p
la
y
ed from the left.
T : Temperature
H : Humidity
V : Air Velocity
P : Differential Pressure