
User Manual Manual

3. Display Description and Operation Procedure 51
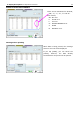
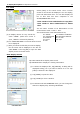
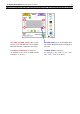
When you configure the chart settings as shown above, the chart will be shown as below.
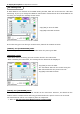
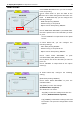
The MAX value set in the OPTION tab in
the CHART SETTING window is applied to
the chart.
Tap MAX value to change it.
(It changes in the order of “10”, “20”,
“50”, “100”, “150”, and “300”.)
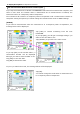
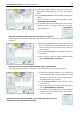
The MAX and MIN values set for each
sensor in the OPTION tab in the CHART
SETTING window is applied in the chart.
Tap MAX or MIN value to change it.
(It changes in the order of MIN & MAX
settings 1, 2, and 3.)