
Datasheet


K A S P E R S K Y H O S T E D S E C U R I T Y S E R V I C E S
40
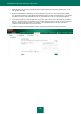
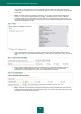
You can filter on either groups or user (not a combination of both). Clicking the Add group or Add user
button will bring up a popup where you can select them, When you save, only the open filter (group or user)
will be saved.
Step 4: For those reports that are based on categories, you can select a subset of these categories to
report on. You can select multiple categories for the filter. The default option is to report on all traffic
accessed, whether that is a Web page the user has clicked on, or images/files within the Web page. You
can select to filter the report so that only pages which the user has clicked for are displayed, by clicking the
‘Display HTTP Webpages only’ filter.
Step 5: Schedule the report delivery by selecting the specific start date using the drop down boxes and
selecting the frequency of the scheduled report delivery – either Once only, Daily, Every 7 days, or Every 30
days.
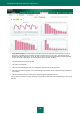
Step 6: Select formatting options for the report (including typing in a report title) and layout options by
selecting a table or graph presentation or both. You may also select the top ‘N’ (number) for the
presentations you have selected, such as the ‘Top 50 Categories by Connections’.
Step 7: Select the report recipients by selecting the email group, entering the subject line of the email, the
message text and a password to open and review the report. If you want to create new email groups or edit
existing ones, click the ‘Email Groups’ button.