
Instruction Manual


6
6. Operation of measurement program
The operation of each measurement screen of the measurement program is explained below.
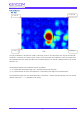
(1) Main screen
This is the first screen displayed when starting the measurement program. Operate this screen to perform image data
acquisition and RCS calculation operation.
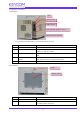
No. Name Operation explanation
(1) Image display area This is an image display area where image images and graphs of
measurement data are displayed.
(2) Title Enter the name of the measurement. This input is saved in the
measurement data file.
(3) Comment Enter comments on measurement. This input is saved in the measurement
data file.
(4) Distance range Enter the distance range for which you want to measure the image.
Received signals outside the distance range are not displayed and are not
used for calculation. It can be set between 3 m and 55 m.
・Recalculate Click the Recalculate button when changing the distance range.
(5) Image This area allows you to make settings for displaying images.
・Max Level /Min Level Specify the maximum value and minimum value of the image display level.
・Redraw Click this to re-display the image.
・Cell frame display When checked, a border appears on the cell border of the image.
・φ Axis Fit To Screen When checked, in the image display, theφaxis is expanded to fill the
screen in the same way as ± 10 ° regardless of the set angle of the tilt.
・Distance specification You can drag the slide bar and display the image of the cross section with
the distance specified in units of 15 cm in the image display area.
(6) P (d) Graph This area can be used to display the P (d) Graph of the relationship
(1)
(2)
(3)
(4)
(5)
(6)
(7)
(8)
(9)
(10)
(11)
(13 )
(12)
(14)
(15)