LOGBOX SD Datalogger Instruction Manual
DECLARATION OF CONFORMITY Manufacturer: Kipp & Zonen B.V. Delftechpark 36 2628 XH Delft the Netherlands T +31 15 2755 210 F +31 15 2620 351 info@kippzonen.com http://www.kippzonen.com Description of the product: Ultra-low power data logger Type: LOGBOX SD The indicated product corresponds to the regulation of the following European Directives: 204/108/EEC This is provided by the compliance with the following standards: EN 61000-6-3, EN 61000-6-2, EN61000-4-6, EN 61000-4-4, EN 61000-4-2. Date: 11.1.
TABLE OF CONTENTS DECLARATION OF CONFORMITY ...................................................................................................................................... 2 LOGBOX SD ................................................................................................................................................................................ 2 TABLE OF CONTENTS ....................................................................................................................
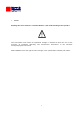
1 NOTES Reading this entire manual is recommended for a full understanding of this product. The exclamation mark within an equilateral triangle is intended to alert the user to the presence of important operating and maintenance instructions in the literature accompanying the instrument. KIPP & ZONEN reserve the right to make changes in the specifications without prior notice.
2 WARRANTY AND LIABILITY KIPP & ZONEN guarantees that the product delivered has been thoroughly tested to ensure that it meets its published specifications. The warranty included in the conditions of delivery is valid only if the product has been installed and used according to the instructions supplied by KIPP & ZONEN. This product is under warranty for 24 months from the date of purchase. Modifications made by the customer or on customer request can affect the validity of the CE declaration.
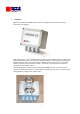
3 INTRODUCTION LOGBOX SD is a data logger for slow varying signals and accepts low voltage signals. It features low noise, high resolution and low power consumption. LOGBOX SD is a universal data logger, configurable by software, suitable for mobile as well as permanent installation used in laboratory and in the field. It can be used under all weather conditions. A mounting plate for installation on a mast is provided. The LOGBOX SD was designed with the above criteria in mind.
4 SPECIFICATIONS 7
5 OVERVIEW LOGBOX SD is designed for measuring, processing, recording (data logging) of measured data in real time for the needs of meteorology and slow signals analyses. It employs eight analogue inputs, which can be configured by software as unipolar inputs with 12 bits resolution or as unipolar/bipolar differential inputs with 24 bit resolution. With definition of polynomial coefficients (of the 3-rd order) measured values are converted to engineering units.
6 HARDWARE Mechanical solution of LOGBOX SD is based on single board design with minimal dimensions and weight. Fi Outer dimensions 115mm (width), 90mm (height) a 50mm (depth) makes it suitable for mobile applications, too. Connectors inside are located on left and right side, from the bottom there are inputs for sensor cables. Thanks to clear layout the user can easily connect relatively large number of sensors. For better access to input connections, connectors are divided by three.
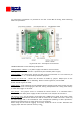
For permanent installation it is possible to use four screws M4 for fixing, while achieving IP65 class protection. Fig.8 Inside view – description of connectors LOGBOX SD board has the following components: Lithium battery, CR2032 - It is power supply reserved for real time clock. During normal operation the RTC is powered by the available power supply. Jumper RESET – by shorting the jumper you will reset the instrument. It is not necessary to use it by the user – it is reserved for production purposes.
Connector for main battery – the user can connect any type of battery (ZnMn, alkaline, NiCd, NiMH, lithium, Pb accu, solar panel, mains adapter) with output voltage in the range of 4Vdc – 20Vdc. LED jumper – when jumper is closed, LED diode will indicate the operation. For maximum power savings open the jumper. The LED indicates also when communication with SD card can be performed. So, if LED is on, do not manipulate (remove or insert) SD card. Otherwise, data could be either lost or partially damaged.
When long time data recording is required, it is possible to use the SD memory card. LOGBOX SD can accept any memory size above 128MB. After inserting the card in the data logger, processor checks size of the card and proper formatting. If necessary, LOGBOX SD will format the card (its own format) and starts to write data to SD memory card. If the user wants to remove the card, it is recommended to put the data logger to sleep mode first and wait until indication LED turns off.
7 QUICK START LOGBOX SD is supplied ready for use. After unpacking it is necessary to open the case with four screws. After removing the cover switch the instrument from transport mode to measuring mode by switch (from position SLEEP to position ON). Now connect main battery to power terminals. Battery must be in the range 4...20Vdc. For power supply there is holder for four AA type batteries. You can use them, or use different appropriate (external) power supply.
Last step is to connect the (supplied) serial cable RS232 with the computer. The LOGBOX SD software can be used to setup the logger and related sensors. Or setup your communication software on your computer (e.i. HyperTerminal) for standard speed 115200bps, 8 data bits, 1 stop bit, parity none and handshaking none. Then you will see measured data from LOGBOX SD. LOGBOX SD is ready to operate.
8 CONNECTING MULTIPLE SENSORS DIFFERENTIAL This configuration allows you to connect up to 3 sensors on the analog input 1-6 which have an output up to 2500mV. -AIN1 & AIN2 (first sensor) -AIN3 & AIN4 (second sensor) -AIN5 & AIN6 (third sensor) And it’s possible to connect up to two sensors on the analog inputs 7 and 8 which have an output up to 3000mV.
9 CONNECTING A PT-100 This configuration allows you to connect up to one PT100 temperature sensors: -AIN1 & AIN2 (100R reference resistor) -AIN3 & AIN4 (current) -AIN2 & GND (measuring PT100) Besides the Pt-100 it’s possible to connect up to one sensor on the analog input which has an output up to 2500mV between AIN 5 and AIN 6. -AIN5 & AIN6 (only sensor) And it’s possible to connect up to two sensors on the analog inputs 7 and 8 which have an output up to 3000mV.
10 CONNECTING A THERMISTOR. In the above illustration one 10K thermistor is connector to AIN 6 but in practice it can be connected to any of the eight analog inputs. -VREF & AINx (measuring 10k thermistor) -AINx & GND (10k reference resistor) It`s common for a Pyrgeometer or Pyranometer to have one 10K thermistor.
11 PC CONFIGURATION SOFTWARE The PC Configuration software is designed for easy set up of the LOGBOX SD for the used radiometers or sensors. It is very intuitive in use and a full configuration can be made in just a few minutes. The LOGBOX SD software is a simple executable file, without the need for further installation. It is compatible with Win9x, Win2000 and WinXP operating systems. First of all it is necessary to copy LOGBOX SD.exe and sensor.ini files to your computer.
11.1 Toolbar The top menu offers the following: In this menu you can create new configurations (New) and save them (Save As…), or you can open existing configuration (Open…). Last four configurations are directly accessible. With Exit you will close the application. Edit menu will allow to perform undo command, which is usable during creating or modifying the configuration. The View menu offers turn on or off toolbar and status bars.
11.2 Sensor configuration. (Analog) In the first window [Analog] you can select all parameters of the analog inputs. The program has incorporated basic control over resolution rules for inputs, described in hardware section. Analog input, which should be logged, must be checked. Second item is for user predefined sensors. Sensor description is included in sensor.ini file, with strictly defined syntax. Because not every sensor can be connected to any input read the manual for more explanation.
Resolution can be set for 12 or 24 bits. 24bits resolution is used for low level signals. This type of measurements takes longer time (approximately 1 second per measurement). Input mode can be selected to unipolar or bipolar. Bipolar mode is mostly selected for 24 bit differential resolution. Input voltage range is selected for 24 bit resolution only and can be selected from one of eight available ranges. For each input one of eight polynomials can be selected for calculation to engineering units.
Last parameter for analog inputs is the ratio. Ratio is only checked for appropriate analog input. Ratio is used primary for PT100 measurement. If ratio is selected, it‘s output value is calculated as ratio of selected analog input voltage measured to analog input 1 voltage input. Only then polynomial calculation is applied. Ratio option is available for two analog inputs only. Analog inputs 7 and 8 can only be setup for single ended, 12 bit resolution, unipolar input, and 3000mV range only.
11.4 Baud rate settings. Next window is for serial line speed setup. Speed can be selected from the range 300bps up to 115200bps. Please, note that 8 bit, no parity, 1 stop bit and no hardware control is used. Serial line speed applies only to serial line during measurement. If you will go to service mode, 115200bps is set automatically.
11.5 Logging options. In the logging window the logging period can be selected in the range of 10 seconds up to 1hour. Sensor start-up delay can be selected in the range from 0 seconds up to 9 seconds. Memory management (for the internal memory of 128 kB) has the following options: circular (after the memory is full, the oldest data will be over written) or on-stop (after all memory is used, new data will no longer be stored in memory, even though the measurements will be performed).
11.6 Sensor configuration. (Digital) In the Digital window you can enable and configure the parameters for the digital inputs. The Digital input, which should be active, must be checked. Important: The CSD 3 sunshine duration output can only be used on DIN3. Next, it is possible to setup type of input measured (time, frequency or counter). For each input one of eight polynomials can be selected for calculation to engineering units. None can be selected as well.
11.7 Writing options to memory card. For SD memory card there is one more window. If you want to use SD card for data storage it is necessary to check Use SD Card box. Otherwise, data logger will not communicate with SD card. This option is usable when the user has no SD card or wants to use data logger only for short time logging and need faster response from data logger. Important: When using the SD card the “logging to memory” should be set to Circular.
11.8 Sending or reading the entire configuration. Additionally, there are two buttons. First one is used for read configuration from LOGBOX SD data logger. It is especially valuable if you have lost your configuration files or if you have LOGBOX SD with unknown configuration. Send Config is used to setup the LOGBOX SD with the currently entered and on screen displayed configuration.
11.9 Downloading logdata. The Download screen can be accessed by View/Download Data menu or by clicking on the icon. This screen is divided into four windows. -Time & Date -Internal Memory -Power -SD Memory. Power window shows reference voltage setup in LOGBOX SD. This value is read from data logger and updates when the “Get Values” button is clicked. The “system supply” is an internal electronic feature which is not relevant for users of the Logbox SD.
The Internal Memory window shows (after Get Values command) the actual value of the used and free memory. Also, automatically it is calculated how much time it will take to fill the internal memory with the current configuration. The total logging time to fill internal memory depends on how many channels are logged and the logging interval. Also, there is a download button, which will start downloading the measured data from internal memory of LOGBOX SD.
During download, there is progress bar indicating actual status of download. Time & Date window shows actual setup of LOGBOX SD (after Get Value command) or the user can setup individually time and date. If Windows system time and date is used, check the option. The Last window shows files stored on SD memory card. It is updated only after Get Values command. In this window user can see the card size, current address for writing and how much percent is used on the card.
12 POLYNOMIALS CALCULATION FOR SENSORS This section will explain how to change the polynomial to be applied when you are using radiometers inside the Logbox SD graphical user interface. Each pre-defined radiometer has a default Polynomial. (A1) This could be set to100 or 10, and needs to be changed to have a correct reliable output in W/m². Step1 : Look at your radiometer, and locate the sensitivity. This is located on the radiometer itself and on 2 the calibration certificate.
13 POLYNOMIALS CALCULATION FOR PT100 AND THERMISTOR This section will explain how to create your own polynomials to be applied when you are using other PT100 or TH10K components with different specifications. When selecting the pre-defined PT100 or TH10K in the analog section it uses the pre-defined polynomials to calculate the output in ˚C. Kipp & Zonen uses a particular PT100 or TH10K which can be purchased in different classes, behaving differently to temperature changes.
Figure 1 Figure 2 Let’s begin to create our own polynomials: Step 1: Collect the information as shown in figure 1 and 2. Step 2: Insert this information in an excel sheet. (See Figure 3) It is advisable to insert all the data. (The example only shows 4 values) R C F 135,200 -30 -22 127,900 -29 -20,2 121,100 114,600 -28 -18,4 -27 Figure 3. -16,6 Step 3: Translate this information into a graphical chart.
Figure 4. Step 4: Time to add a trendline by right clicking on the line inside the graphical chart and select “add trendline”” rd -Select the polynomial option, put it on 3 degree , and do not forget to put a checkmark in the box “display equation on chart” at the options. An example is shown in Figure 5, where Excel 2007 ism used to do this.
Figure 5. Step5 : The result will be : Step 6: Adding the polynomials into the Logbox SD graphical user interface.
If you want to have the output displayed in Kelvin or Fahrenheitplease make sure to create the graphical chart using the Fahrenheit or Kelvin information which result in a different polynomial.
Polynomials for UVS: Polynomial in mV: To have the output values recorded in mV (miliVolt) we will have to enter the following polynomial A1=1 If you are only interested in the UV values recorded by the instrument you would probably like to have these reading in W/m². Polynomial in W/m²: To have the output values recorded in W/m² we will need to make some calculations using the mean sensitivity values of the UVS instruments.
Polynomial in Kelvin: This section will explain how to have the temperature readings to be in Kelvin. Inside the manual of the UVS you will find a table to convert the Voltage output of the UVS into the temperature (°C) You can enter these values inside Excel and add a trend line through the graphic representations. This will provide you with the Polynomial (3rd degree) to be entered inside the Logbox SD coefficient area.
14 FIRMWARE The Firmware inside LOGBOX SD is relatively comprehensive. It is due to the complex control functions: measuring analog and digital inputs, auto calibrations, real time calculations, calculations to engineering units based on polynomial of the 3-rd order, data logging to the memory, service of output ports, communication ports RS232 and RS485, power management and user interface. User interface offers the following analog inputs setup options: 12 bit resolution for unipolar input range 0...
15 SERVICE MODE To access service mode, you need to wake up LOGBOX SD from sleep mode. You will type CTRL+BREAK on your serial line once. If there is no response after about 5 seconds, try again (data logger is serial line sensitive only for about 50% of time due to low power operation). Then, your communication software must be set for communication speed 115200bps, as service mode is accessible with this speed only. You will receive following answer from the LOGBOX SD: LOGBOX SD (C) Physicus.
0 Are you sure that you want to erase all logs?! CAP = erase, else = quit Y ERASED. OK F Save configuration to the memory U Setup communication speed for serial line U You can use the following baud rates: 300 1200 2400 4800 9600 19200 38400 57600 115200 Switch between them by and confirm by Baud Rate = 115200 If you type you will roll over mentioned intervals.
FINAL SDWritting = 1 minutes J Setup file close interval on SD card J You can use the following SD card FILE_CLOSING intervals: 10 20 30 minutes, 1, 2, 3, 4, 5, 6, 12, 24 hours and Always Switch between them by and confirm by If you type you will roll over mentioned intrevals. If you will type you will receive following response FINAL SdFileClose = 24 hours l Type all data in memory l 2004-11-27 2004-11-27 2004-11-27 2004-11-27 10:46:03 10:47:03 10:48:03 10:49:03 55.
Assign for A[X] 24 bit resolution A[X]WI (X represents analog input. X [1...8]) Assign for A[X] 12 bit resolution A[X]IS (X represents analog input. X [1...5]) Set A[X] for single ended input. Only for 24 bit resolution A[X]ID (X represents analog input. X [1...3]) Set A[X] for differential input. Only for 24 bit resolution A[X]IU (X represents analog input. X [1...5]) Set A[X] for unipolar input. Only for 24 bit resolution A[X]IB (X represents analog input. X [1...5]) Set A[X] for bipolar input.
P[X][Y] (X represents indexed nr. of polynomial, Y represents coefficient. Y[any real number]) Set up coefficients of polynomial 15.1.1 P40 =0 OK >P41 P41 =10000 OK >P42 P42 =125E-7 OK >P43 P43 -321.245 OK P? Returns all coefficients of all polynomials P? 1: 0 2.25 0.0009813 0 2: Not set. 3: Not set. 4: 0 10000 125E-7 –321.245 5: Not set. 6: Not set. 7: Not set. 8: Not set. OK Other configuration commands LE Clear all settings for logging L[X]1 (X represents analog or digital input. X[1...
Checks for card format. If wrong, it will format the card and prepare for data logging. If the card format is ok and there are logged files it will display all files on the card. ? Wait a minute. Checking the SD card. LOGBOX SD SD card format OK. ELOG0000.TXT 51 2007-06-16 13:21:06 ELOG0001.TXT 512 2007-06-16 13:22:00 ELOG0002.TXT 4886 2007-06-16 13:30:00 ELOG0003.TXT 7922 2007-06-16 13:40:00 ELOG0004.TXT 7922 2007-06-16 13:50:00 ELOG0005.TXT 7922 2007-06-16 14:00:00 ELOG0006.TXT 7922 2007-06-16 14:10:00 ..
Channels, which are disabled for logging are indicated with „/“. YYYY - year MM - month DD - day HH - hour MM - minute SS - second AIN1...AIN8 – analog input calculated to engineering units DIN1...
16 APPLICATION EXAMPLES Example 1. Connection of relative humidity and temperature sensors. Example 2. Memory capacity calculation Let’s assume we measure and store data from channels AIN1, AIN2 and DIN1 every 5 minutes. Now calculate how many bytes will take one record: Date – 4 bytes Time – 4 bytes AIN1- 4 bytes AIN2 – 4 bytes DIN1 – 4 bytes Together it is 20 bytes for one record.
Example 3. Calculation of battery capacity Let’s assume we measure temperature, relative humidity and global radiation. Measuring interval is one minute. Requested autonomy for battery is 7 days. Now we will calculate power consumption of each component of the system. For temperature measurement we will use PT100, where excitation current is 1mA maximum. We need to add delay of 5 second to settle the output. For relative humidity measurement we can use HumiAir8 sensor. It has power consumption 6mA max.
17 FAQ • • Q: What is the extension of the log file? A: The extension is .TXT or .XLS Using the software interface you can select to save this as a text -or Excel file. • • Q: What is the format of the log file ? A: The format uses columns, an example is given : • • Q: What do the values represent at A1, A2 ,A3 , A7 etc. in the log ? A: In the columns after time and date the radiation values are shown of the connected instruments in W/m2.
• • Q: Can you explain something how a data logger works ? A: Every logger has an A/D converter with a certain resolution (number of bits) - you see often 10, 12, 16 or 24 bits resolution A logger also has a fixed number of analog input ranges - you see often 20 mV, 100 mV, 1 V, 5 V and 10 Volt ranges Let’s take for example we use a logger with 12 bits resolution and 5 Volt input range. This means that the 5 Volt is divided in 2¹² steps. This is 5/4096 = 0.
AIN AIN AIN AIN AIN 1 2 3 4 6 = = = = = Plus from CMPupw Plus from CMPdown Plus from CGRupw Plus from CGRdown common ground for all above instruments. Vref = 10K thermistor AIN 5 = 10K thermistor & 10K reference resistor GND = 10K reference resistor. The next illustration displays the software configuration: Please do not forget to enter the Polynomials P2 - P5 inside the coefficient area.
Our customer support remains at your disposal for any maintenance or repair, calibration, supplies and spares. Für Servicearbeiten und Kalibrierung, Verbrauchsmaterial und Ersatzteile steht Ihnen unsere Customer Support Abteilung zur Verfügung. Notre service ‘Support Clientèle’ reste à votre entière disposition pour tout problème de maintenance, réparation ou d’étalonnage ainsi que pour les accessoires et pièces de rechange.