KODAK VISION Color Print Control Strips, Process ECP-2D Technical Data and Crossover Information Professional Motion ©Eastman Kodak Company, 2006
0 KODAK VISION Color Print Control Strips, Process ECP-2D
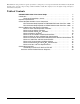
Note: While the data presented are typical of production coatings, they do not represent standards which must be met by Kodak. Varying storage, exposure, and processing conditions will affect results. The company reserves the right to change and improve characteristics at any time. Table of Contents KODAK VISION Color Print Control Strips . . . . . . . . . . . . . . . . . . . . . . . . . . . Introduction . . . . . . . . . . . . . . . . . . . . . . . . . . . . . . . . . . . . . . . . . . . . . . . . . . . .
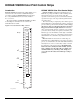
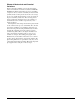
KODAK VISION Color Print Control Strips Introduction KODAK VISION Color Print Control Strips KODAK VISION Color Print Control Strips (Figure 1) are intended for the control of Process ECP-2D using the procedures described in KODAK Publication No. H-24, Processing KODAK Motion Picture Films, Module 1, Process Control. The catalog numbers for KODAK VISION Color Print Control Strips are CAT 156 1323 for 35 mm, and CAT 820 8498 for 16 mm.
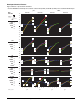
Effects of Mechanical and Chemical Variations Figures 2 through 12 illustrate some of the photographic effects of mechanical and chemical variations on KODAK VISION Color Print Control Strips exposed on 2383 Film compared to effects on batch codes 6101 (35 mm) and 6102 (16 mm) and above. Each plot shows the effect of a change in a process variable (horizontal axis), on the dye density of the processed film (vertical axis). These density plots are deviated against the standard level for each variable (e.g.
Developer Mechanical Factors Figure 2 Effects of Time and Temperature Variations —Current VISION Control Strips versus batch codes 6101 (35 mm) and 6102 (16 mm) in Process ECP-2D Developer Time AIM VALUES REFERENCE STRIP CODE NO. Temperature Old 2383 .25 New 2383 Old 2383 R G GR .20 0000 New 2383 G R B B G .15 R HD .10 RED GREEN .05 + 0 BLUE .05 B/W .10 B B .15 B R G B R .20 GB R R G GR .25 .20 .05 .10 .15 GBR .10 .10 G R .
Developer Chemical Factors Figure 3 Effects of pH and CD-2 Variations —Current VISION Control Strips versus batch codes 6101 (35 mm) and 6102 (16 mm) in Process ECP-2D Developer pH AIM VALUES REFERENCE STRIP CODE NO. CD-2 Old 2383 New 2383 Old 2383 R .20 0000 New 2383 .25 R .15 HD .10 RED GREEN .05 + 0 BLUE .05 B B/W .10 G R .15 .20 G G B B B G B R R B G B R G B G .25 .20 B .05 .10 .15 G R G B B G R B R G R G .20 H326_PH_CD2 B G G B B G R G R B .10 .
Developer Chemical Factors Figure 4 Effects of NaBr and Na2CO3 Variations —Current VISION Control Strips versus batch codes 6101 (35 mm) and 6102 (16 mm) in Process ECP-2D Developer Na 2 CO 3 AIM VALUES REFERENCE STRIP CODE NO. Old 2383 NaBr Old 2383 New 2383 New 2383 .25 .20 0000 .15 HD .10 RED GREEN .05 + 0 BLUE .05 B/W .10 G R B B R G R G B R G B G R B G R B B R G G R B .15 .20 .25 .20 MD RED GREEN BLUE B/W .15 .10 B .05 + 0 G R B R G B R G B R G G R B .05 .
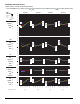
Developer Chemical Factors Figure 5 Effects of Na2SO3 Variations —Current VISION Control Strips versus batch codes 6101 (35 mm) and 6102 (16 mm) in Process ECP-2D Developer Na 2 SO 3 AIM VALUES REFERENCE STRIP CODE NO. Old 2383 New 2383 .25 .20 0000 .15 HD .10 RED GREEN .05 + 0 BLUE .05 B/W .10 R B R G R G B G B B G R G B R R G B G R B B G R R G B B R G G R B .15 .20 .25 .20 MD RED GREEN BLUE B/W .15 .10 .05 + 0 .05 .10 .15 .20 RED GREEN BLUE .10 .10 .
Developer Chemical Factors Figure 6 Effects of AF-2000 and Prebath 2 Contamination —Current VISION Control Strips versus batch codes 6101 (35 mm) and 6102 (16 mm) in Process ECP-2D Developer AF2000 AIM VALUES REFERENCE STRIP CODE NO. Old 2383 Prebath 2 New 2383 Old 2383 New 2383 .25 .20 0000 HD .15 .10 GREEN .05 + 0 BLUE .05 B/W .10 RED R G B B R G .15 B .20 R .25 G R B G R G B .20 .05 G .10 .15 BLUE H326_PREBATH2_AF2000 8 B G R G B R R G B R G B B R G .10 .10 .
Developer Chemical Factors Figure 7 Effects of CD-3 for CD-2 and Stop Bath Contamination —Current VISION Control Strips versus batch codes 6101 (35 mm) and 6102 (16 mm) in Process ECP-2D Developer Substitute CD-3 for CD-2 AIM VALUES REFERENCE STRIP CODE NO. Old 2383 Stop Bath New 2383 Old 2383 New 2383 .25 .20 0000 .15 HD .10 RED GREEN .05 + 0 BLUE .05 B/W .10 B .15 R G R B G .20 .25 B R G B G R .20 B/W .05 B B R G .10 R .15 G .20 BLUE B R G .05 B G R G B R .10 .10 .
Developer Chemical Factors Figure 8 Effects of Persulfate Accelerator and Hydroxylamine Sulfate Contamination —Current VISION Control Strips versus batch codes 6101 (35 mm) and 6102 (16 mm) in Process ECP-2D Developer Accelerator AIM VALUES REFERENCE STRIP CODE NO. Old 2383 Hydroxylamine Sulfate New 2383 Old 2383 New 2383 .25 .20 0000 .15 HD .10 RED GREEN .05 + 0 BLUE .05 B/W G R G R B B .10 B B G R G .15 R .20 .25 .20 MD RED GREEN BLUE B/W G G R R B B G G .15 .10 .
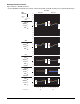
Developer Chemical Factors Figure 9 Effects of F-35B Fixer and NaCl Contamination —Current VISION Control Strips versus batch codes 6101 (35 mm) and 6102 (16 mm) in Process ECP-2D Developer Fixer AIM VALUES REFERENCE STRIP CODE NO. Old 2383 New 2383 .25 B G .15 HD .10 RED GREEN .05 + 0 BLUE .05 B/W .10 Old 2383 New 2383 B .20 0000 NaCl G R R G R G B R B .15 .20 .25 .20 MD RED GREEN BLUE B/W G R B B G R .15 R G .10 .05 + 0 G R B B .05 .10 .15 .
Developer Chemical Factors Figure 10 Effects of KI Contamination and Water Dilution —Current VISION Control Strips versus batch codes 6101 (35 mm) and 6102 (16 mm) in Process ECP-2D Developer Kl AIM VALUES REFERENCE STRIP CODE NO. Water Dilution Old 2383 .25 New 2383 G R G New 2383 R .20 0000 Old 2383 B B .15 HD .10 RED GREEN .05 + 0 BLUE .05 B/W .10 R .15 G B R B G .20 .25 .20 MD RED GREEN BLUE B/W G R G R B B .15 .10 B .05 + 0 B R G .05 R G .10 .15 .20 .
Developer Chemical Factors Figure 11 Effects of Bacterial Na2S and Na2SO4 Contamination —Current VISION Control Strips versus batch codes 6101 (35 mm) and 6102 (16 mm) in Process ECP-2D Developer Na 2 S Na 2 SO 4 AIM VALUES REFERENCE STRIP CODE NO. Old 2383 New 2383 Old 2383 New 2383 .25 .20 0000 .15 HD .10 RED GREEN .05 + 0 BLUE .05 B/W .10 B R G R G B G G R .15 R .20 B B .25 .20 .05 R .10 R B .15 B .20 GREEN BLUE H326_Na2SO4_Na2 B R .10 .10 .05 + 0 .05 B .
Developer Chemical Factors Figure 12 Effects of Under- and Over-Replenishment —Current VISION Control Strips versus batch codes 6101 (35 mm) and 6102 (16 mm) in Process ECP-2D Developer Under and Over Replenishment AIM VALUES REFERENCE STRIP CODE NO. Old 2383 New 2383 .25 .20 0000 G R .15 HD .10 RED GREEN .05 + 0 BLUE .05 B/W .10 G R R .15 B B B .20 R .25 G G R .20 MD RED GREEN BLUE B/W .15 G .10 R G R .05 + 0 B B .05 .10 B B .15 .
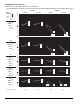
Control-Strip Crossover Important: During the inventory crossover from the previous batch Control Strips to the new VISION Control Strips, every effort should be taken in your operations to avoid switching back and forth. Your process control will be greatly simplified by depleting your supply of the EXR Control Strips (except for what is needed for crossover purposes) prior to utilizing the VISION Control Strips. There will come a time when you will need to begin using a new batch of control strips.
Figure 13 Control-Strip Crossover for Process ECP-2D EASTMAN Process Record Form (H-24F) CONTROL NUMBER .25 AIM VALUES N E W C U R R E N T Control Strip Crossover Process ECP-2D .20 .15 .10 HD 3.04 RED 2.70 GREEN R-3.10 G-3.15 B-3.31 .05 + 0 Code 9011 .05 2.45 BLUE .10 B/W .15 .20 .25 .20 MD .15 .10 RED GREEN BLUE R-1.10 G-1.30 B-1.31 0.97 0.95 0.88 .05 + 0 .05 B/W .10 .15 .20 LD .10 RED GREEN BLUE CB action = 0.06 CB control = 0.08 R-0.23 G-0.29 B-0.34 0.21 0.21 0.27 .
KODAK VISION Color Print Control Strips, Process ECP-2D 17
KODAK VISION Color Print Control Strips, Process ECP-2D Technical Data and Crossover Information MORE INFORMATION For more information on motion picture products, call or write to the Professional Motion Imaging office nearest you. Or access Kodak’s home page on the Internet, web site address— http://www.kodak.com/go/motion/ You may want to bookmark our location so you can find us more easily.