
Instruction Manual User Manual

8.7 KEW6305
8-2 Changing displayed items
There are 3 display screens on DEMAND range, and the screens are common to each wiring
configuration.
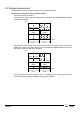
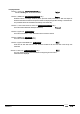
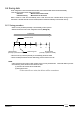
● Screens can be changed with Cursor keys as follows.
Middle row: Predicted demand value
Upper row: Target demand value
Lower row: Present demand value
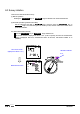
Middle row: Load factor
Upper row: Remaining time for demand
interval elapse
Lower row: Present demand value
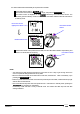
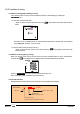
Middle row: Time when the max. demand
measured (hour/ minute/ second)
Upper row: Date when the max. demand
was recorded (year/ month/ day)
Screen 2
Screen 3
Lower row: Max. demand value
recorded so far
Screen 1