
User Manual

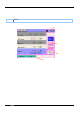


8.1.1 Demand Measurement – Display Screen KEW6310
8.3 KEW6310
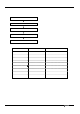
Shifts in specific period
Displayed
para me te r s
Detail s
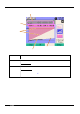
Load Factor
Percentage of the present value against the target value.
(Present value)
(Target value)
Prediction
Percentage of the predicted value against the target value.
(Predicted value)
(Target value)
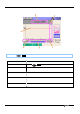
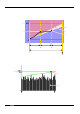
Arrow mark on the graph (
◂
) is blue w hile the graph i s w ithin the t arge t de mand ,
and becomes red w hen the t arge t va lue i s exceed ed .
Remaining ti me (Time le f t)
Target demand
Present value
Load factor / Prediction
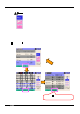
Prediction