
User Manual

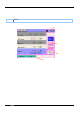

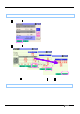

KEW6310 8.1.1 Demand Measurement – Display Screen
KEW6310 8.4
Cursor
Demand change
A long press of Cursor Keys changes pages.
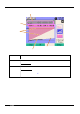
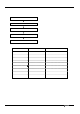
Display ed para me ters Details
Cursor
Use the Cursor Key to move the cursors.
Measured max deman d with
time and date information
Demand value is displayed with recorded time & date info where a
cursor poin t s.
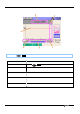
Bar Graph
White bar : Percentage of hidden pages
Blue bar: Percentage of the present displayed pages
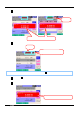
Recording start date & time
T i me and da te w hen th e 1
st
recording started
T i me in fo o f the old est da t a in recent 150 0 da t a pt s is di splayed when
number of data exceeds 1500.
Most recent recorded
date & time
T ime and date of the latest recorded data is displayed.
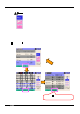
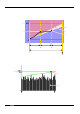
Measured demand w ith time and
date info rmatio n
Target demand
Bar Graph
Recording start
date an d ti m e
Most recent recorded
date an d ti m e