
User Manual


10.1.1 Harmonic Analysis – Display Screen KEW6310
10.3 KEW6310
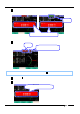
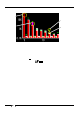
Graph
Red bar graph : present value
White bar graph : preset allowable range (refer to clause 4.2.2 for further details)
Green mark : max recorded value during a measurement, displayed while MAX HOLD
function i s a cti v a ted. Re fe r to c lau se 4.2.2 for further details about MAX
HOLD function.
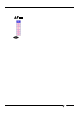
* Max value w ill be re set w hen ;
- pressing the ESC Key at least 2 sec,
- switching channels with Cursor Keys. (excep t w hen sa ving da t a), o r
- starting data saving.
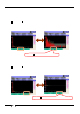
Exceeding
axis value
A
llowable rang e
MAX hold ON:
displayed while
it is activated.
Exceeding the
threshold