
User's Manual


Page 3 of 4
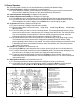
1. Indoor temperature
2. Temperature measurement
3. Indoor humidity
4. Selected temperature sensor
5. Temperature measurement
6. Indication of sensor number
7. Humidity of selected sensor
8. Low battery indication
9. Pressure indication
10. Pressure unit (inHg or hPa)
11. Rainfall unit (inches or mm)
12. Rainfall rate
13. Period of rainfall rate (1-hour, 24-hours, total)
14. Pressure trend indicator
15. Pressure history of past 24 hours
16. Weather forecast symbol
17. Indicates minimum readings displayed
18. Indicates maximum readings displayed
19. Date
20. Time
21. Wind speed units (mph, km/h, knots, or Beaufort)
22. Wind speed indicator or direction in °
23. Wind rose of direction in 5° increments
3.0 General Operation
3.1. Once the program is started, you can view all information by selecting View-Weather Display
3.2. Current information is displayed simultaneously in normal operation.
3.2.1. Indoor temperature, humidity, outdoor temperature, humidity, pressure, pressure trend, 24-hour pressure
history bar chart, rainfall rate, forecast icon, wind speed and direction, time and date.
3.3. Indoor temperature and humidity are displayed in the upper left.
3.4. Outdoor temperature and humidity are displayed n the upper right.
3.4.1. Press Outd. key once to view dewpoint, twice to view wind chill, three times to view normal temperature
3.4.2. If you have more than one outdoor sensor (note that additional sensors are available for indoor as well, but
will be displayed in the “outdoor” display), press the Sensor key to cycle through (up to eight).
3.5. Air pressure information is displayed on the right side
3.5.1. Current air pressure is displayed under the outdoor humidity
3.5.2. Pressure trend indicator is in lower left corner ( quickly rising, steadily rising, èsteady, steadily falling,
ê quickly falling)
3.5.3. The 24-hour history bar chart is to the left of the trend indicator. This indicates graphically the history of the
pressure for the past 24 hours. Current pressure (“0h”) is always shown with five bars. The other bars will be
more or less depending on the past pressure. Fewer bars indicates the pressure was lower, more bars
indicates the pressure was higher. Each bar represents a change of 2 millibars (hPa).
3.5.4. The weather forecast icon is to the left of the bar chart. It will indicate rainy, cloudy, partly cloudy or sunny.
This forecast is based on the pressure trend. Rising pressure generally indicates fair weather. Falling
pressure generally indicates cloudy or rainy weather. The amount of pressure change and the period it occurs
in determines the forecast. Actual weather is based on many other variables; thus, a forecast by pressure
trend is about 75% accurate.
3.6. Rainfall rate is displayed in the center of the LCD.
3.6.1. Pressing the Rain key cycles through the totals of rain for last hour, last 24 hours, or total since last reset.
3.6.2. To view the time and date of the last reset, press the Reset key briefly. The time and date will display in the
lower left corner. It will display for five seconds, then display the current time and date.
3.6.3. To reset the total accumulated rainfall, press and hold the Reset key for four seconds. There will be an
audible beep and the screen will blink once. The total rainfall amount is now “0.0”. The 24-hour and last hour
totals cannot be reset.
3.7. Wind speed and direction is on the left side of the LCD.
3.7.1. The average wind direction between transmissions is displayed as arrows on the wind rose.
3.7.2. In the middle of the wind rose is the wind speed or direction. Pressing the Wind key cycles through the
measurement options. MphèKnots èm/s èèkm/h BeaufortèDirection in 5° increments.
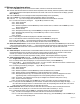
3.7 Display