
User Manual


Pressure Readings
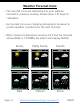
History Graph:
• Read from left to right, your Pressure History Graph indicates
the rise and fall in air pressure over the past 24 hours.
• The numbers below represent the hour in which the
reading was taken. The “0h” is the current pressure level.
“-3h” was the reading taken three hours ago, compared to
current pressure.
•The graph will scroll continually. This cannot be turned o.
Your station provides Relative Barometric Pressure in:
• Numbers-programmable in the settings menu
• History Graph- provides pressure trend for the past 24 hours
Pressure number:
• Your station will acclimate to the correct pressure without
setting it yourself.
• You also have the option of setting the pressure number to
match your local reporting station by using the settings
menu.
• In the settings menu you can also select the pressure unit of
Inches of Mercury (inHg default) or Hecto Pascal (hPa).
S84107 www.lacrossetechnology.com/support Page | 8