
Current Draw & Thermal Dissipation

Current Draw and Thermal Dissipation
IPD Series: Intelligent Power Drive Amplifiers
IPD 2400
Item no. CDTD-IPD2400 - 03.12.2015
W WW.LABGRUPPEN.COM
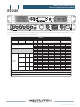
The following tables contain information on measured current consumption as well as calculated heat dissipation during what we see as
the most extreme sustained normal operation (1/8 rated power).
IPD 2400
Level Load Rated power
Mains
voltage
Line
current
Watt *1) Thermal Dissipation
VAC IAC *2) In Out Dissipated BTU/hr kCal/hr
Standby w. remote Power Off.
230 0.088 7.10 0 7 24 6
120 0.0981 6.45 0 6 22 6
100 0.11 6.45 0 6 22 6
Power on, Idling
230 0.229 28.20 0 28 96 24
120 0.383 29.20 0 29 100 25
100 0.44 27. 4 0 0 27 94 24
Pink Pseudo
Noise (1/8)
16 Ω / Ch. 300 x 2
230.0 1.1 127 75 52 178 45
120.0 1.7 127 75 52 177 45
100.0 1.8 114 75 39 134 34
8 Ω / Ch. 600 x 2
230.0 1.9 218 150 68 233 59
120.0 3.0 229 150 79 270 68
100.0 3.8 239 150 89 303 76
4 Ω / Ch. 1200 x 2
230.0 3.3 431 300 131 448 113
120.0 5.3 455 300 155 530 133
100.0 6.1 451 300 151 514 129
2 Ω / Ch. 800 x 2
230.0 2.3 279 150 129 439 111
120.0 3.4 260 150 110 376 95
100.0 4.1 258 150 108 368 93
*1) The amplifier’s PSU operates as a non-resistive load, so the calculation “Volts x Amps = Watts” would not be correct. Instead, measured and specified here
is what is known as the “Active Power” in the amplifier providing useful, real-world values of power consumption and heat dissipation.
*2) Current draw figures measured at 230 V. as well as 120 V. The efficiency is similar, but not identical for the two scenarios. The efficiency for 100 V mains is
very similar to that of 120 V.