
Operating Instructions


12
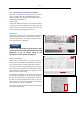
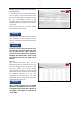
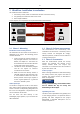
2.5 Data Analysis
The data analysis is realised in a linked
Power BI Dashboard. The Power BI
Dashboard is accessed via the "View
Dashboard" button in the PowerApps
application.
Achten Sie darauf, dass dem Projekt
bereits Sensordaten zugeordnet sind.
Ohne Sensordaten ist das Power BI
Dashboard leer. Der Haken „This
project is connected with sensor data“
muss auf grün stehen.
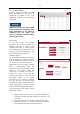
Start screen
In the start screen, the essential
parameters of the fleet recording are
displayed. The data is based on the
available sensor data, i.e. if more vehicles
are created than sensor data available, the
number of actually available data in the
selected period is referred to here.
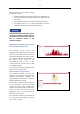
Activity analysis
The measurement method of the activity
trackers enables the analysis of activity
times. By moving the tracker at the start of
the journey, the start time is recorded.
Afterwards, the activity tracker switches
back to energy-saving mode and
measures in a 4-minute cycle whether the
vehicle is still moving. When the
movement is complete, this period is
counted for activity. At the end, the
activity analysis shows in a bar chart the
percentage activity of the vehicle
compared to the maximum operating
time over the day. The operating times
and break times were considered here. For
better classification, adequate activity
times for benchmarking are also shown.
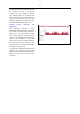
The presentation of the activity analysis
follows two variants:
1. Breaks and shift times are taken into account (Shift Activity).
Travel times outside the shift schedule are ignored in the
calculation.
2. The percentage activity is related to 24h of the day (24h).
3. Percentage activity as in 1 with consideration of driving
times outside shifts. (24h related to shift times)
NOTICE
Project Name