
Operating Instructions


13
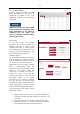
The presentation of the activity analysis
follows two variants:
1. Breaks and shift times are taken into account (Shift Activity).
Travel times outside the shift schedule are ignored in the
calculation.
2. The percentage activity is related to 24h of the day (24h).
3. Percentage activity as in 1 with consideration of driving
times outside shifts. (24h related to shift times)
The data from the PowerApp is used as
a basis for the shift and break times. If
the entries there are incorrect, this can
lead to erroneous results in the
workload analyses.
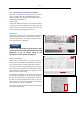
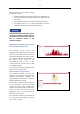
Aggregated visualisation of thr activity
over the measurement period
The following can be read in the
aggregated representation of the activity:
Over the entire measurement period, the
activity was analysed via the daily profile.
The graph now shows the probability of
the vehicle being active at the
corresponding time of day. In this
example, the truck is active at 10 a.m. with
a probability of 80%.
The evaluation can help to identify certain
patterns in the shift patterns.
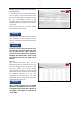
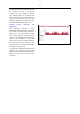
Parallel activity in the pie chart
The individual activities of the trucks
already give a good first impression for
potential optimisations. However, the
group behaviour of the trucks is crucial for
identifying potential savings.
That is why it is important to pay attention
to the grouping of the trucks when
creating the fleet data. Forklifts that
perform an equivalent activity in the direct
vicinity of each other with the same
equipment have a great potential to
achieve a bundling gain.
This illustration shows the percentage of
the time how many forklifts of a group
were active in parallel.
NOTICE