
Operating Instructions


14
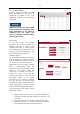
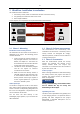
To identify optimisation potential, look at
the number of trucks in the group
compared to the percentage of activity
time of these stackers. It can happen that
only a small percentage of all trucks in the
group are active at the same time. All
trucks belonging to the same group must
have the same shift and break times.
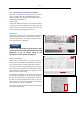
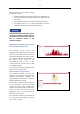
Parallel activity animated and
aggregated
This illustration provides a better
understanding of the parallel activity. Here
the number of parallel active stackers is
shown over the measurement period.
After the initial guess in the pie chart, the
period can be analysed here to determine
peaks in the utilisation of the forklift
group. You can use the analysis to discuss
the peak loads with the customer. This
allows the customer to develop strategies
to relieve the peak periods.
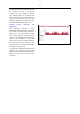
To increase the understanding of the peak
utilisation, the animated version of the
display is used. Changes over the different
days of the week can be traced in the
animation.