
Datasheet


LT1790
11
1790fb
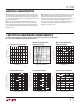
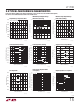
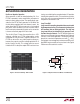
1.25V TYPICAL PERFORMANCE CHARACTERISTICS
TEMPERATURE (°C)
–50
1.247
OUTPUT VOLTAGE (V)
1.248
1.249
1.250
1.251
–10 30
70
110
17091.25 G01
1.252
1.253
–30 10
50
90
FOUR TYPICAL PARTS
INPUT-OUTPUT VOLTAGE (V)
OUTPUT CURRENT (mA)
10
17901.25 G02
0.1
1
0.5 2.521.51
0
T
A
= 125°C T
A
= –55°C
T
A
= 25°C
TEMPERATURE (°C)
–50
0
VOLTAGE DIFFERENTIAL (V)
0.1
0.3
0.4
0.5
1.0
0.7
–10
30
50 130
17091.25 G03
0.2
0.8
0.9
0.6
–30 10
70
90
110
5mA100μA
1mA
OUTPUT CURRENT (mA)
0.1
–2000
OUTPUT VOLTAGE CHANGE (ppm)
–1600
–1200
–800
–400
110
17901.25 G04
0
–1800
–1400
–1000
–600
–200
T
A
= –55°C
T
A
= 25°C
T
A
= 125°C
OUTPUT CURRENT (mA)
0.1
0
OUTPUT VOLTAGE CHANGE (ppm)
400
800
1200
1600
110
17901.25 G05
2000
200
600
1000
1400
1800
T
A
= –55°C
T
A
= 25°C
T
A
= 125°C
INPUT VOLTAGE (V)
SUPPLY CURRENT (μA)
60
80
100
15
17901.25 G06
40
20
50
70
90
30
10
0
5
0
10
20
T
A
= –55°C
T
A
= 25°C
T
A
= 125°C
Output Voltage Temperature Drift
Load Regulation (Sourcing)
Minimum Input-Output Voltage
Differential (Sourcing)
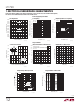
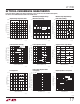
Minimum Input-Output Voltage
Differential (Sinking)
Load Regulation (Sinking)
Supply Current vs Input Voltage
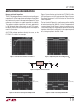
Note 8: Peak-to-peak noise is measured with a single pole highpass fi lter
at 0.1Hz and a 2-pole lowpass fi lter at 10Hz. The unit is enclosed in a still
air environment to eliminate thermocouple effects on the leads. The test
time is 10 seconds. Integrated RMS noise is measured from 10Hz to 1kHz
with the HP3561A analyzer.
Note 9: Long-term drift typically has a logarithmic characteristic and
therefore changes after 1000 hours tend to be smaller than before that
time. Long-term drift is affected by differential stress between the IC and
the board material created during board assembly. See the Applications
Information section.
Note 10: Hysteresis in the output voltage is created by package stress that
differs depending on whether the IC was previously at a higher or lower
temperature. Output voltage is always measured at 25°C, but the IC is
cycled to 85°C or –40°C before a successive measurements. Hysteresis
is roughly proportional to the square of the temperature change.
Hysteresis is not a problem for operational temperature excursions where
the instrument might be stored at high or low temperature. See the
Applications Information section.
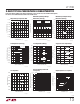
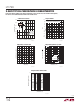
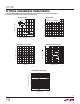
ELECTRICAL CHARACTERISTICS
Each of the voltage options have similar performance curves. For the 3V, 3.3V and the 4.096V options,
the curves can be estimated based on the 2.5V and 5V curves.