
Datasheet

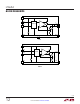


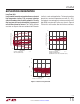


Table Of Contents
- Features
- Applications
- Description
- Typical Application
- Absolute Maximum Ratings
- Pin Configuration
- Order Information
- Available Options
- Electrical Characteristics
- Typical Performance Characteristics
- Pin Functions
- Block Diagrams
- Applications Information
- Typical Applications
- Package Description
- Revision History
- Typical Application
- Related Parts

LT6654
15
6654fd
For more information www.linear.com/LT6654
applicaTions inForMaTion
similar to a real world application. The boards were then
placed into a constant temperature oven with T
A
= 35°C,
their outputs scanned regularly and measured with an 8.5
digit DVM. Long-term drift curves are shown in Figure 8.
Their drift is much smaller after the first thousand hours.
Long-Term Drift
Long-term drift cannot be extrapolated from accelerated
high temperature testing. This erroneous technique
gives drift numbers that are wildly optimistic. The only
way long-term drift can be determined is to measure it
over the time interval of interest. The LT6654 drift data
was taken on 40 parts that were soldered into PC boards
Figure 8. LT6654-2.5 Long Term Drift
TIME (HOURS)
0 200 400 800600
–80
–40
0
OUTPUT VOLTAGE CHANGE (ppm)
80
40
6654 F08a
1000
LT6654-2.5 S6 PACKAGE
FIRST THOUSAND HOURS
TIME (HOURS)
1000 1200 1400 18001600
–80
–40
0
OUTPUT VOLTAGE CHANGE (ppm)
80
40
6654 F08b
2000
LT6654-2.5 S6 PACKAGE
SECOND THOUSAND HOURS
(NORMALIZED TO THE FIRST THOUSAND HOURS)
TIME (HOURS)
0
PPM
80
–40
40
0
–80
1000500
6654 G38
20001500
LT6654-2.5 LS8 PACKAGE