
Datasheet


LTC1403-1/LTC1403A-1
7
14031fc
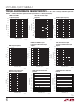
TYPICAL PERFORMANCE CHARACTERISTICS
Differential and Integral Linearity
vs Conversion Rate
CONVERSION RATE (Msps)
2 2.25 32.5 3.75 42.75 3.25
LINEARITY (LSB)
14031 G10
8
7
6
5
4
3
2
1
0
–1
–2
–3
–4
MAX INL
18 CLOCKS PER CONVERSION
MAX DNL
MIN DNL
MIN INL
3.5
CONVERSION RATE (Msps)
2 2.25 3.252.75 432.5 3.753.5
S/(N+D) (dB)
14031 G11
78
77
76
75
74
73
72
71
70
69
68
EXTERNAL V
REF
= 3.3V f
IN
~ f
S
/3
EXTERNAL V
REF
= 3.3V f
IN
~ f
S
/40
INTERNAL V
REF
= 2.5V f
IN
~ f
S
/3
INTERNAL V
REF
= 2.5V f
IN
~ f
S
/40
FREQUENCY (Hz)
0
MAGNITUDE (dB)
–60
–30
–20
14031 G07
–70
–80
–120
800k200k 400k 600k 1M 1.2M 1.4M
–100
0
–10
–40
–50
–90
–110
Differential Linearity
vs Output Code
Integral Linearity
vs Output Code
OUTPUT CODE
0
–1.0
DIFFERENTIAL LINEARITY (LSB)
–0.8
–0.4
–0.2
0
1.0
0.4
4096
8192
14031 G08
–0.6
0.6
0.8
0.2
12288
16384
OUTPUT CODE
0
–4
INTEGRAL LINEARITY (LSB)
–3
–1
0
4
1
4096
8192
14071 G09
–2
2
3
12288
16384
FREQUENCY (Hz)
MAGNITUDE (dB)
–60
–30
–20
14031 G21
–70
–80
–120
–100
0
–10
–40
–50
–90
–110
0
700k350 1.05M 1.4M
FREQUENCY (Hz)
MAGNITUDE (dB)
–60
–30
–20
14031 G22
–70
–80
–120
–100
0
–10
–40
–50
–90
–110
0
700k350 1.05M 1.4M
1.3MHz Sine Wave 4096 Point
FFT Plot for Differential Input
Signals
10.7MHz Sine Wave 4096 Point
FFT Plot for Differential Input
Signals
OUTPUT CODE
0
–4
INTEGRAL LINEARITY (LSB)
–3
–1
0
4
1
4096
8192
14071 G23
–2
2
3
12288
16384
Integral Linearity vs Output Code
for Differential Input Signals
T
A
= 25°C, V
DD
= 3V. Single ended A
IN
+
signal drive
with A
IN
–
= 1.5V DC, differential signals drive both inputs with V
CM
= 1.5V DC (LTC1403A-1)
1.4MHz Input Summed with
1.56MHz Input IMD 4096 Point FFT
Plot for Differential Input Signals
SINAD vs Conversion Rate