
Datasheet


LTC2859/LTC2861
13
285961fc
from a driver transition may exceed the hysteresis levels
on the logic and data inputs pins causing an unintended
state change. This can be avoided by maintaining normal
logic levels on the pins and by slewing inputs through
their thresholds by faster than 1V/µs when transitioning.
Good supply decoupling and proper line termination also
reduces glitches caused by driver transitions.
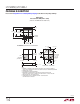
Cable Length vs Data Rate
For a given data rate, the maximum transmission distance
is bounded by the cable properties. A typical curve of cable
length vs data rate compliant with the RS485 standard is
shown in Figure 14. Three regions of this curve reflect
different performance limiting factors in data transmis-
sion. In the flat region of the curve, maximum distance is
determined by resistive losses in the cable. The downward
sloping region represents limits in distance and data
rate due to AC losses in the cable. The solid vertical line
represents the specified maximum data rate in the RS485
standard. The dashed lines at 250kbps and 20Mbps show
the maximum data rates of the LTC2859/LTC2861 in Low-
EMI and normal modes, respectively.
Figure 14. Cable Length vs Data Rate
(RS485 Standard Shown in Solid Lines)
applicaTions inFormaTion
285961 F14
DATA RATE (bps)
CABLE LENGTH (FT)
10k 1M 10M100k 100M
100
1k
10
10k
LOW-EMI MODE
MAX DATA RATE
RS485 MAX
DATA RATE
NORMAL
MODE MAX
DATA RATE
Multi-Node Network with End Termination Using LTC2859
Typical applicaTions
TE = 5V
TE = 5V
TE = 0V
R
D
TE = 0V
R
D
2859/61 TA04
R
D
LTC2859
R
D
LTC2859
LTC2859LTC2859