
Datasheet


LTC6409
14
6409fa
applicaTions inForMaTion
the input of the ADC to 50Ω can actually be detrimental
to system performance.
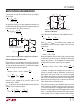
The definition of 3rd order intermodulation distortion
(IMD3) is shown in Figure 8. Also, a graphical repre-
sentation of how to relate IMD3 to output/input 3rd
order intercept points (OIP3/IIP3) has been depicted in
Figure 9. Based on this figure, Equation (4) gives the
definition of the intercept point, relative to the intermodu-
lation distortion.
OIP3=P
O
+
IMD3
2
(4)
P
O
is the output power of each of the two tones at which
IMD3 is measured, as shown in Figure 9. It is calculated
in dBm as:
P
O
=10log
V
2
PDIFF
2 • R
L
• 10
–3
(5)
where R
L
is the differential load resistance, and V
PDIFF
is
the differential peak voltage for a single tone. Normally,
intermodulation distortion is specified for a benchmark
composite differential peak of 2V
P-P
at the output of the
50Ω
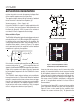
V
IN
+
–
50Ω
V
IN
+
–
–
+
150Ω
1.3pF
150Ω
150Ω
150Ω
50Ω
1:4
6409 F07
1.3pF
V
OCM
V
IN
+
–
600Ω
e
no
= 4.70nV/√Hz
NF = 14.41dB
–
+
200Ω
1pF
200Ω
100Ω
100Ω
50Ω
1:4
1pF
V
OCM
V
IN
+
–
e
no
= 5.77nV/√Hz
NF = 10.43dB
–
+
500Ω
500Ω
100Ω
100Ω
50Ω
1:4
V
OCM
V
IN
+
–
e
no
= 11.69nV/√Hz
NF = 8.81dB
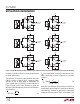
–
+
150Ω
1.3pF
150Ω
150Ω
150Ω
50Ω
1.3pF
V
OCM
V
IN
+
–
e
no
= 5.88nV/√Hz
NF = 17.59dB
–
+
200Ω
1pF
200Ω
100Ω
100Ω
1pF
0.4pF
0.4pF
0.8pF
0.8pF
V
OCM
e
no
= 9.76nV/√Hz
NF = 16.66dB
–
+
250Ω
250Ω
50Ω
50Ω
V
OCM
e
no
= 14.23nV/√Hz
NF = 13.56dB
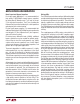
Figure 7. LTC6409 Measured Output Noise and Noise Figure at Different Closed Loop Gains with and without Source Impedance Matching