
Datasheet


LTC6655
17
6655fd
For more information www.linear.com/LTC6655
Performance Characteristic section. Noise performance
can be further improved by wiring several LTC6655s in
parallel as shown in the Typical Applications section. With
this technique the noise is reduced by √N, where N is the
number of LTC6655s in parallel.
Noise Specification
Noise in any frequency band is a random function based
on physical properties such as thermal noise, shot noise,
and flicker noise. The most precise way to specify a random
error such as noise is in terms of its statistics, for example
as an RMS value. This allows for relatively simple maximum
error estimation, generally involving assumptions about
noise bandwidth and crest factor. Unlike wideband noise,
low frequency noise, typically specified in a 0.1Hz to 10Hz
band, has traditionally been specified in terms of expected
error, illustrated as peak-to-peak error. Low frequency
noise is generally measured with an oscilloscope over a
10 second time frame. This is a pragmatic approach, given
that it can be difficult to measure noise accurately at low
frequencies, and that it can also be difficult to agree on the
statistical characteristics of the noise, since flicker noise
dominates the spectral density. While practical, a random
sampling of 10 second intervals is an inadequate method
for representation of low frequency noise, especially for
systems where this noise is a dominant limit of system
performance. Given the random nature of noise, the output
voltage may be observed over many time intervals, each
giving different results. Noise specifications that were
determined using this method are prone to subjectivity,
and will tend toward a mean statistical value, rather than
the maximum noise that is likely to be produced by the
device in question.
Because the majority of voltage reference data sheets
express low frequency noise as a typical number, and as
it tends to be illustrated with a repeatable plot near the
mean of a distribution of peak-to-peak values, the LTC6655
data sheet provides a similarly defined typical specification
in order to allow a reasonable direct comparison against
similar products. Data produced with this method gener
-
ally suggests that in a series of 10 second output voltage
measurements, at least half the observations should have a
peak-to-peak value that is below this number. For example,
applicaTions inForMaTion
the LTC6655-2.5 measures less than 0.25ppm
P-P
in at
least 50% of the 10 second observations.
As mentioned above, the statistical distribution of noise
is such that if observed for long periods of time, the
peak error in output voltage due to noise may be much
larger than that observed in a smaller interval. The likely
maximum error due to noise is often estimated using the
RMS value, multiplied by an estimated crest factor, assumed
to be in the range of 6 to 8.4. This maximum possible value
will only be observed if the output voltage is measured
for very long periods of time. Therefore, in addition to the
common method, a more thorough approach to measuring
noise has been used for the LTC6655 (described in detail in
Linear Technology’s AN124) that allows more information
to be obtained from the result. In particular, this method
characterizes the noise over a significantly greater length
of time, resulting in a more complete description of low
frequency noise. The peak-to-peak voltage is measured
for 10 second intervals over hundreds of intervals. In ad
-
dition, an electronic peak-detect circuit stores an objective
value for each interval. The results are then summarized in
terms of the fraction of measurement inter
vals for which
observed noise is below a specified level. For example,
the LTC6655-2.5 measures less than 0.27ppm
P-P
in 80%
of the measurement intervals, and less than 0.295ppm
P-P
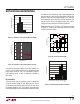
in 95% of observation intervals. This statistical variation
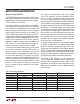
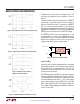
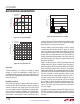
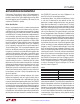
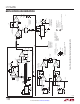
in noise is illustrated in Table 2 and Figure 18. The test
circuit is shown in Figure 17.
Table 2
Low Frequency Noise (ppm
P-P
)
50% 0.246
60% 0.252
70% 0.260
80% 0.268
90% 0.292
This method of testing low frequency noise is superior to
more common methods. The results yield a comprehensive
statistical description, rather than a single observation. In
addition, the direct measurement of output voltage over
time gives an actual representation of peak noise, rather
than an estimate based on statistical assumptions such
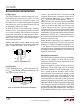
as crest factor. Additional information can be derived from
a measurement of low frequency noise spectral density,
as shown in Figure 19.