
User Manual


Doc #: L-802-1110 Page 18 Rev. 02
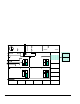
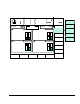
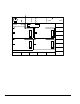
Figure 7 shows a four channel screen when viewing reverse tonnages. Notice that there are no limit bars
when viewing reverse tonnage as there is only one reverse limit for each channel.
Tonnage
Monitor
EXIT
CHANGE
VIEW
FORWARD
TONNAGE
GRAPH
BYPASS
SETP
DIAGNOS
View
Peak
Reverse Tonnage
Total
7.3
Tons
150%
0%
CH1 - Left Rear
Rev Limit: -
1.9
Tons
Status OK
150%
0%
CH2 - Right Rear
Status OK
150%
0%
CH3 - Left Front
Status OK
150%
0%
CH4 – Right Front
Status OK
Module Status: OK
REV LIMITS
ON/OFF
BYPASS
ON/OFF
CONFIGURE
AUTO-SETUP
n
Stroke
Mode
Single Stroke
Drive
Speed
SPM
SPM
0
0
Order
Counter
Current Status
Counter OFF
0
0
Progra m/Run Switch
TOP
Stroke
Speed
RESET
FAULT
CHANGE
REV LIMIT
2.4
Rev Limit: - 2.0 Rev Limit: - 2.0
Rev Limit: - 2. 5
1.5
Tons
1.7
Tons
2.3
Tons
Figure 7: Tonnage Monitor Main Screen Showing Reverse Tonnage
In Figure 7, an additional setting in the reverse tonnage view is:
n) Reverse Limit
Value
The reverse tonnage limit setting for this channel. Note that only peak tonnage
has a reverse limit.
REV LIMITS
ON/OFF Softkey
This softkey toggles the reverse limits between ON and OFF. See section
3.2.2 on page 19 for more information on limits.
FORWARD
TONNAGE Softkey
This softkey will change the tonnages displayed back to peak forward tonnage.
See section
3.2.1 on page 18 for more information.
3.2.1 Selecting a View
As explained in Section 2.2, data windows can monitor “local” peaks with a separate set of setpoints
from the “absolute” peak. Each set of tonnages and limits makes up a “view” in this screen and is
indicated by the box in the upper left of the screen as shown by “h” and “g” in
Figure 5. The absolute
peak tonnages and associated limits are called the “peak view”. In all, there are six different “views” of
tonnages and settings - peak forward, peak reverse, data window 1 forward, data window 2 forward, data