
User Guide
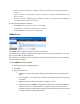
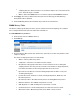
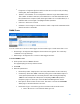

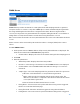
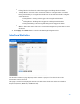

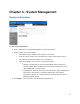
Table Of Contents
- Chapter 1 – Getting Started
- Chapter 2 – System Status
- Chapter 3 – Quick Start
- Chapter 4 – System Management
- Chapter 5 – Port Management
- Chapter 6 – VLAN Management
- Chapter 7 - Spanning Tree Management
- Chapter 8 - MAC Address Management
- Chapter 9 – Multicast
- Chapter 10 - IP Interface
- Chapter 11 - IP Network Operations
- Chapter 12 – Security
- Chapter 13 - Access Control List
- Chapter 14 - Quality of Service
- Chapter 15 - Maintenance
- Chapter - 16 Support

13
•
Sampling Interval—Enter the time in seconds that samples are collected from the
ports. The field range is 1-3600.
•
Owner—Enter the RMON station or user that requested the RMON information.
4.
Click Apply. The entry is added to the History Control Table page, and the Running
Configuration file is updated.
5.
Click the History button (described below) to view the actual statistics.
RMON History Table
The History Table page displays interface-specific statistical network samplings. The samples
were configured in the History Control table described above.
To view RMON history statistics:
1.
Click
System Status > RMON > History
.
2.
Click History.
3.
From the History Entry Index drop down menu, optionally select the entry number of the
sample to display.
The fields are displayed for the selected sample.
•
Owner—History table entry owner.
•
Sample No.—Statistics were taken from this sample.
•
Drop Events—Dropped packets due to lack of network resources during the
sampling interval. This may not represent the exact number of dropped packets,
but rather the number of times dropped packets were detected.
•
Bytes Received—Octets received including bad packets and FCS octets, but
excluding framing bits.
•
Packets Received—Packets received, including bad packets, Multicast, and
Broadcast packets.
•
Broadcast Packets—Good Broadcast packets excluding Multicast packets.
•
Multicast Packets—Good Multicast packets received.
•
CRC Align Errors—CRC and Align errors that have occurred.
•
Undersize Packets—Undersized packets (less than 64 octets) received.
•
Oversize Packets—Oversized packets (over 2000 octets) received.