
User Guide
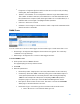

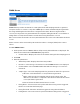
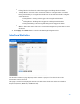

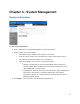
Table Of Contents
- Chapter 1 – Getting Started
- Chapter 2 – System Status
- Chapter 3 – Quick Start
- Chapter 4 – System Management
- Chapter 5 – Port Management
- Chapter 6 – VLAN Management
- Chapter 7 - Spanning Tree Management
- Chapter 8 - MAC Address Management
- Chapter 9 – Multicast
- Chapter 10 - IP Interface
- Chapter 11 - IP Network Operations
- Chapter 12 – Security
- Chapter 13 - Access Control List
- Chapter 14 - Quality of Service
- Chapter 15 - Maintenance
- Chapter - 16 Support
18
To display Ethernet statistics and/or set the refresh rate:
1.
Click
System Status > Interface Statistics
.
2.
Enter the parameters.
o
Interface—Select the specific interface for which Ethernet statistics are to be
displayed.
o
Refresh Rate—Select the time period that passes before the interface Ethernet
statistics are refreshed. The available options are as follows:
-
No Refresh—Statistics are not refreshed.
-
15 Sec—Statistics are refreshed every 15 seconds.
-
30 Sec—Statistics are refreshed every 30 seconds.
-
60 Sec—Statistics are refreshed every 60 seconds.
o
Total Octets—Octets received, including bad packets and FCS octets, but excluding
framing bits.
o
Unicast Packets—Good Unicast packets received.
o
Multicast Packets—Good Multicast packets received.
o
Broadcast Packets—Good Broadcast packets received.
o
Error Packets—Packets with errors received.
o
Total Octets—Octets transmitted, including bad packets and FCS octets, but
excluding framing bits.
o
Unicast Packets—Good Unicast packets transmitted.
o
Multicast Packets—Good Multicast packets transmitted.
o
Broadcast Packets—Good Broadcast packets transmitted.
To clear or view statistics counters:
•
Click Refresh to refresh the counters on the page.
•
Click Clear to clear the selected interfaces counters.
•
Click View All to see all ports on a single page.