
User Guide

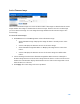

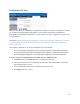
Table Of Contents
- Chapter 1 – Getting Started
- Chapter 2 – System Status
- Chapter 3 – Quick Start
- Chapter 4 – System Management
- Chapter 5 – Port Management
- Chapter 6 – VLAN Management
- Chapter 7 - Spanning Tree Management
- Chapter 8 - MAC Address Management
- Chapter 9 – Multicast
- Chapter 10 - IP Interface
- Chapter 11 - IP Network Operations
- Chapter 12 – Security
- Chapter 13 - Access Control List
- Chapter 14 - Quality of Service
- Chapter 15 - Maintenance
- Chapter - 16 Support
191
To view Queues Statistics:
1.
Click
Configuration > Quality of Service > QoS Statistics > Queues Statistics
.
This page displays the following fields:
•
Refresh Rate—Select the time period that passes before the interface Ethernet
statistics are refreshed.
The available options:
o
No Refresh—Statistics are not refreshed.
o
15 Sec—Statistics are refreshed every 15 seconds.
o
30 Sec—Statistics are refreshed every 30 seconds.
o
60 Sec—Statistics are refreshed every 60 seconds.
•
Counter Set
The available options:
o
Set 1—Displays the statistics for Set 1 that contains all interfaces and
queues with a high DP (Drop Precedence).
o
Set 2—Displays the statistics for Set 2 that contains all interfaces and
queues with a low DP.
•
Interface—Queue statistics are displayed for this interface.
•
Queue—Packets were forwarded or tail dropped from this queue.
•
Drop Precedence—Lowest drop precedence has the lowest probability of being
dropped.
•
Total Packets—Number of packets forwarded or tail dropped.
•
Tail Drop Packets—Percentage of packets that were tail dropped.
2.
Click Add.
3.
Enter the parameters.
•
Counter Set—Select the counter set.
o
Set 1—Displays the statistics for Set 1 that contains all interfaces and
queues with a high DP (Drop Precedence).
o
Set 2—Displays the statistics for Set 2 that contains all interfaces and
queues with a low DP.
•
Interface—Select the ports for which statistics are displayed.
o
Port—Selects the port on the selected unit number for which statistics are
displayed.
o
All Ports—Specifies that statistics are displayed for all ports.
•
Queue—Select the queue for which statistics are displayed.
•
Drop Precedence—Enter drop precedence that indicates the probability of being
dropped.