
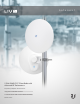
Datasheet
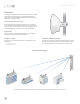


LTU Conguration Interface
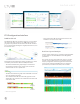
PtMP Dashboard
The Dashboard oers map and Fresnel views* so you can visualize
the network. The map view shows your PtMP links overlaid on a
geographic map, while the Fresnel view shows the link calculated
for your selected CPE, including line of sight, rst Fresnel zone, and
60% clearance zone.
New graphs provide instant status updates and help you to detect
connectivity issues and their eects on PtMP performance:
• The airtime distribution bar graph displays in real time how
much airtime each CPE is using. Click any point to view the
airtime and link score for a specic CPE.
• The AP RF environment bar graph shows ambient RF noise levels
across the frequency spectrum.
• The combined remote RF environment bar graph also shows
ambient RF noise levels but for the combined environment of all
of the remote CPEs.
* Available for models equipped with GPS.
• The local and remote RX rate histograms show the receive
modulation rates of the various CPEs.
Real-Time Spectral Analysis
airView® spectral analysis runs on a dedicated and independent
receiver, which has excellent EVM (Error Vector Magnitude)
performance.
The receiver can also perform other tasks, such as a search for
channel occupancy, DFS detection, and automatic channel/
frequency assignment. Calibration (signal level measurement
accuracy) and resolution bandwidth options are enhanced.
Spectral zoom (user‑dened scan limits) is also available.
4
DATASHEET