
User guide

ISR 320 Manual Software InfraWin 29
Once the temperature entry has been
entered and confirmed with OK,
InfraWin will then calculate the
emissivity slope. The new emissivity
slope will immediately appear along
with the new temperature, which can
be used for further temperature
measurement.
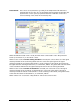
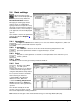
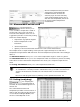
5.8 Measurement online trend
The measurement
function allows you to
access a number of input tabs located on
the left side of the screen. The main or
home tab is the Output Screen. You can
toggle the input tabs on and off by clicking
them. This window displays:
temperature as graphical diagram
internal temperature of the
instrument
current temperature
quantity of the measured values and file size of the current measurement
The example shows a sample reading over the period of approximately 15 seconds with a
temperature range between 700 and 710 °C. The final temperature (at the end of the reading) is
706.3 °C.
The Mark Zone button allows you to color mark a temperature range for easier recognition.
The Threshold button allows you to set a temperature value as a baseline to prevent recording
values above or below the baseline temperature. This allows you to keep the output file size
small.
The Scaling Trend button allows you to scale temperature trend view.
Note: The measuring values of “measurement online trend” are automatically saved
as "standard.i12". Should you need to edit the data later, you need to save the file as
another .i12-file because old values are over-written when a new measurement is
taken.
Files from older program versions (.i10-files) can be opened and saved as .i12.
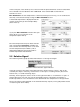
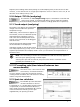
5.9 Listing (analyzing)
For analyzing the
measured values in
this field, all measured data appears in a
numeric list.
The column between time and
temperature provides a time resolution of
milliseconds. The value specifies the time
in seconds after midnight (0:00 h). The
amount of data depends on the