
User Manual


Luminex 100 IS Developer Guide to xMAP Technology Version 2.1 xMAP Technology
18 PN 89-00002-00-062 Rev. A
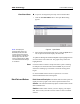
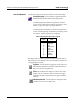
5. Note the numerical gate position indicated in the parenthesis in
the lower left corner of the histogram.
6. Use the numbered gate positions from step 5 in templates and
New Advanced Batches for assays with the same buffer
composition.
7. Select the Y Axis entry, then select the desired value from the
list. To select the axis, hover over the histogram and right-click.
Select Reporter 1 for the X axis parameter. The Histogram displays
reporter-generated intensity data for the sample that is highlighted in
the selected Batch Data Area. With Classification 1 or Classification
2, peaks are based on the emission wavelengths of the classification
dyes inside the microspheres. Choosing Doublet Discriminator
displays data relating to the light-scattering properties of the
microspheres.
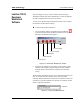
There are four buttons and the Show Bead field at the top of the
histogram:
Show Bead. Select an entry, from the drop-down list, to set the
histogram to show events for only one bead set [bead set number],
<all gated> events, or <all> events. Typically, select <all> (default)
to set the gates.
Auto scale. Automatically adjusts the maximum number of
events shown on the Y axis. Click during acquisition to
readjust the Y axis scale.
Zoom. The zoom function enlarges a specific area on the
histogram display. Left-click and drag to adjust the graph’s
range.
Log/linear. This button is used to toggle the X axis scale
between logarithmic and linear modes.
Maximize. This button enlarges the entire histogram frame.
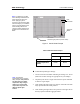
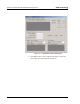
Dot Plot Display The Dot Plot (commonly known as beadmap) is located in the lower-
right section of the screen. This display provides a graphical display
of the real-time data collection as a Dot Plot. You can define the X
axis and Y axis scales from within the display, but we recommend
using the default settings for collection of data. The default axis are
Classification 1 on the X axis and Classification 2 on the Y axis. To
Note: You may want to change
the X axis of the Dot Plot for
troubleshooting purposes. We
highly recommend using the
default settings in all other
instances.
Note: The calculated data uses
only <all gated> events to
determine the final result.