
User Guide


cfchart 69
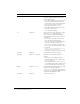
seriesPlacement Optional default Relative positions of series in charts that
have more than one data series.
• default: ColdFusion determines relative
positions, based on graph types
• cluster
• stacked
• percent
show3D Optional yes Whether to display the chart with three-
dimensional appearance:
• yes
• no
showBorder Optional no Whether to display a border around the
chart:
• yes
• no
showLegend Optional yes Whether to display the legend if the chart
contains more than one data series:
• yes
• no
showMarkers Optional yes Whether to display markers at data points in
line, curve, and scatter graphs:
• yes
• no
showXGridlines Optional no Whether to display x-axis gridlines:
• yes
• no
showYGridlines Optional yes Whether to display y-axis gridlines:
• yes
• no
sortXAxis Optional no Whether to display column labels in
alphabetic order along the x-axis:
• yes:
• no
Ignored if the
xAxisType attribute is scale.
style Optional XML file or string to use to specify the style
of the chart.
title Optional Title of the chart.
tipbgcolor Optional white Background color of tips. Applies only to
Flash format graph files.
Hexadecimal value or supported named
color; see the name list in the Usage section.
For a hexadecimal value, use the form
"##xxxxxx", where x = 0-9 or A-F; use two
number signs or none.
Attribute Req/Opt Default Description