
PT-100 Manual


Page 87
© 2017 Sensata Technologies
Appendix A – Specifi cations
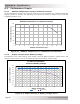
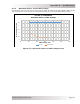
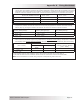
Figure A-3, Maximum Power vs MPP Voltage Curve
A-2.3 Maximum Power verses MPP Voltage
The following curve shows the PT-100’s output power at different PV input MMP voltage levels.
The output power of the PT-100 is consistent throughout it’s PV input MMP voltage range.
4
4.5
5
5.5
6
6.5
7
60 80 100 120 140 160 180
Maximum Power, Kw
MPP Voltage, Vdc
PT-100 vs Competition
Maximum Power vs MPP Voltage
PT-100 Competition