
Manual


166 EZwarePlus Programming Manual
1010-1015, Rev. 03
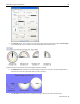
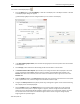
8. In the Pointer section, select arm style, color, length, and width.
9. The Pin point section allows you to adjust the style and size of the pinpoint. See the illustration above to see
the pinpoint (the center of the meter).
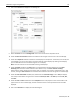
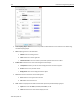
10. Select the Limits tab. In this section, you can configure a scale that goes on the face of the meter that shows
by a color indication when high and low limits have been exceeded. If you look at the above examples, you
will see this is represented on the face of the meter as a red, yellow and green strip.
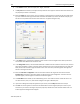
11. In the Value section, select the Zero and Span values. These are the PLC register values that represent the
zero and full-scale deflection of the meter’s arm.
12. In the Range limits section, click the enable check box to enable the limits. Select the colors for low, mid and
high. Select the width, in pixels, of the color band. The values from zero to low limit will be on the 'low' color
band; values from low limit to high limit will be on the 'mid' color band; and values greater than high limit
will be on the 'high' color band.
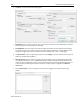
13. Select the Low limit and High limit. These are the values used for the range limit color bands. Click the
Dynamic limits check box to allow PLC registers to determine the low and high limits. The low limit is the
specified register, and the high limit is the next consecutive register.
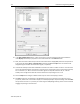
14. The Scale label section allows you to enable labeling on the “main scale tick marks” inside the meter. You
can select the font, color, size, and number of digits to the right of decimal point.
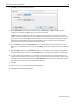
15. If you'd like a background shape to appear with your meter, click the Shape tab and select a shape.
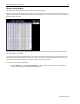
16. Click OK. The meter appears on the work area of EZwarePlus. Click to drag and place your meter on your
work area. If you need to reconfigure any of the properties, deselect the meter and then double click on it
and the properties dialog box will reappear.