
User manual
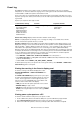
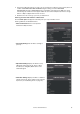
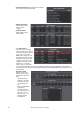
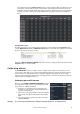
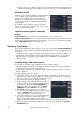
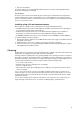
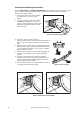
Table Of Contents
36 MAC III Performance user manual
• Fixture Information displays data from the fixture’s
timers when it was last powered up.
• Module Information
displays data from the
fixture’s effects
modules.
• PCB information
displays data from the
fixture’s PCBs.
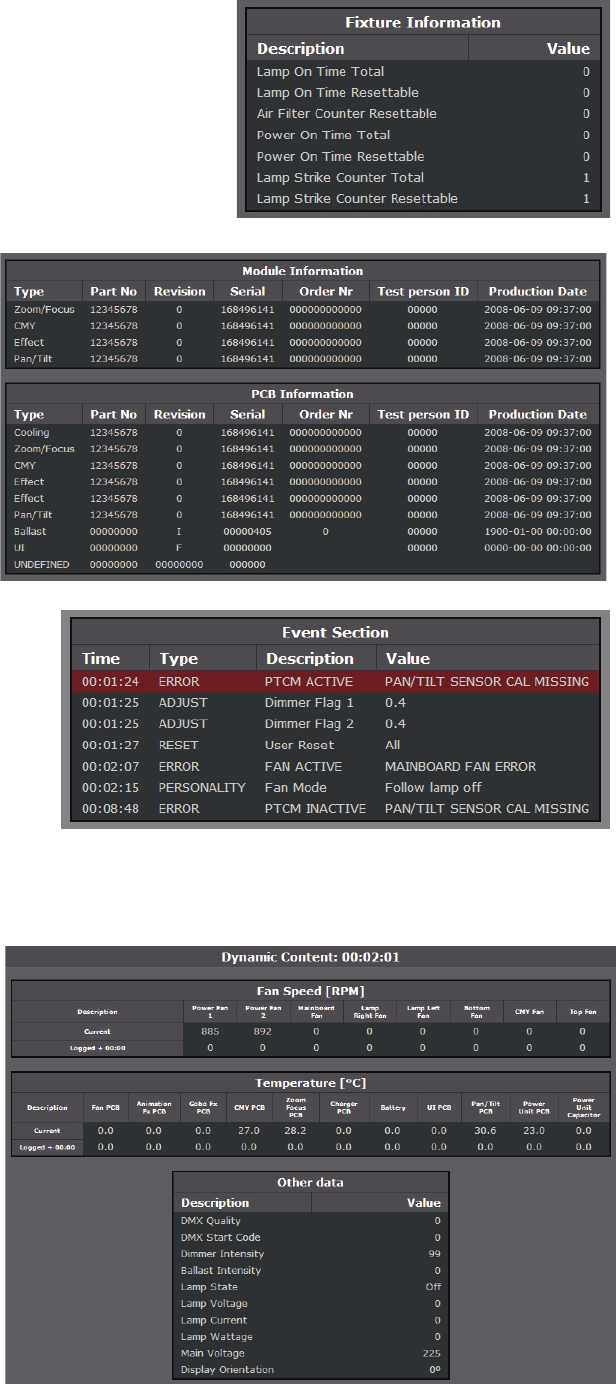
• The Event Section
lists all the errors, warnings
and setting changes carried out
by the user since the last power
cycle in the event log. The
Time column on the left of the
box displays the amount of time
between the fixture powering
up and the event. Thus, in the
example on the right, a main
PCB fan error occurred 2
minutes and 7 seconds after
power up and the pan/tilt sensor was not calibrated (warning was listed as ACTIVE) 1 minute and 24
seconds after power up but was calibrated (warning was listed as INACTIVE) 8 minutes and 48 seconds
after power up.
• Dynamic Content
displays the speed of
the fixture’s fans, fixture
temperatures and other
data:
- current data (in the
example on the right,
two minutes and one
second after power
up).
- previously logged data
(captured at
15-minute intervals
over a total of up to 10
hours, most recent
data at the top — see
following example
showing time).